XB-IMG-121281
Xenbase Image ID: 121281
|
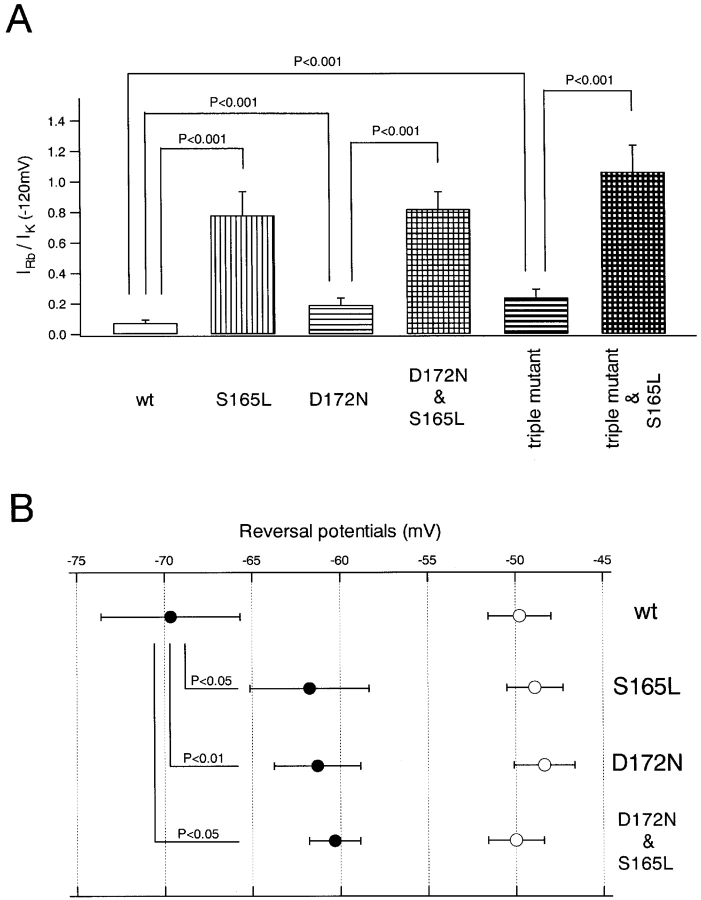
Figure 11. . Quantitative comparison of Rb+ permeance and the permeability ratio of Rb+ and K+ of wild-type Kir2.1 and the mutants. (A) The Rb+/K+ ratios of current amplitudes at −120 mV were calculated from the data in Fig. 9 C; means ± SD (n = 7–12 of each group) and values of P (Student's unpaired t tests) are shown. (B) Means and SD (n = 3–5 of each group) of reversal potentials shown in Fig. 10. The open and filled symbols show values of Erev(K+o) and Erev(Rb+o), respectively. The P values (Student's unpaired t tests) are also indicated. Image published in: Fujiwara Y and Kubo Y (2002) Copyright © 2002, The Rockefeller University Press. Creative Commons Attribution-NonCommercial-ShareAlike license Larger Image Printer Friendly View |