XB-IMG-123900
Xenbase Image ID: 123900

|
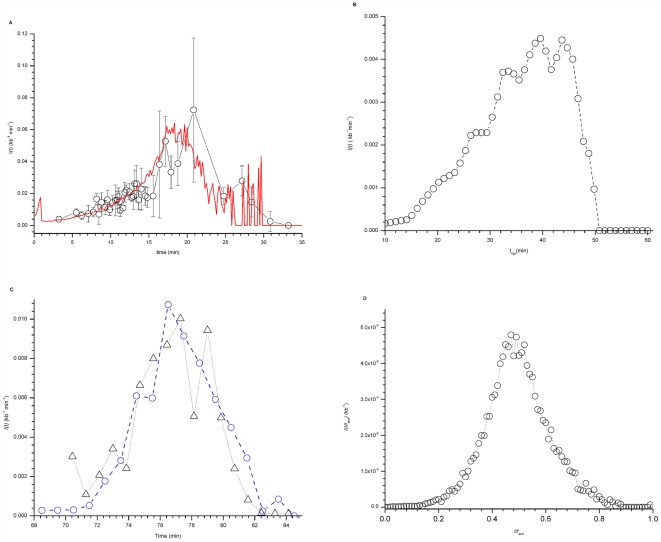
Figure 1. I(t) in X. laevis, S. cerevisiae, S. pombe and D. melanogaster.A. I(t) in X. laevis. I(t) was determined from DNA combing data (open circles) as described in Materials and Methods in [26]. The data points were binned into 40 points and the dispersion in data value of each bin was determined (gray standard deviation bars). The red line is the best fit of the numerical model [26] to the data (χ2 = 0.89). The values of free parameters as described in [26] are: P0 = 1.05×10⁻⁴±1.07×10⁻⁷ kb−1 s−1, P1 = 2.1×10⁻³±2×10⁻⁵ kb−1 s−1, J = 5±0.5 s−1 and N0 = 1000±3. B. I(t) in S. cerevisiae was determined from the replication timing profiles of Raghuraman et al. [3] as described in the Materials and Methods. C. I(t) in S. pombe. Only the 401 strong origins defined by Heichinger et al. [4] (blue circles) and 516 potential origins defined by Eshaghi et al. [5] (black triangles) were considered. D. I(t/tend) for D. melanogaster determined from replication timing profile of chromosome 2L [28]. Image published in: Goldar A et al. (2009) Goldar et al. Creative Commons Attribution license Larger Image Printer Friendly View |
