XB-IMG-169961
Xenbase Image ID: 169961
|
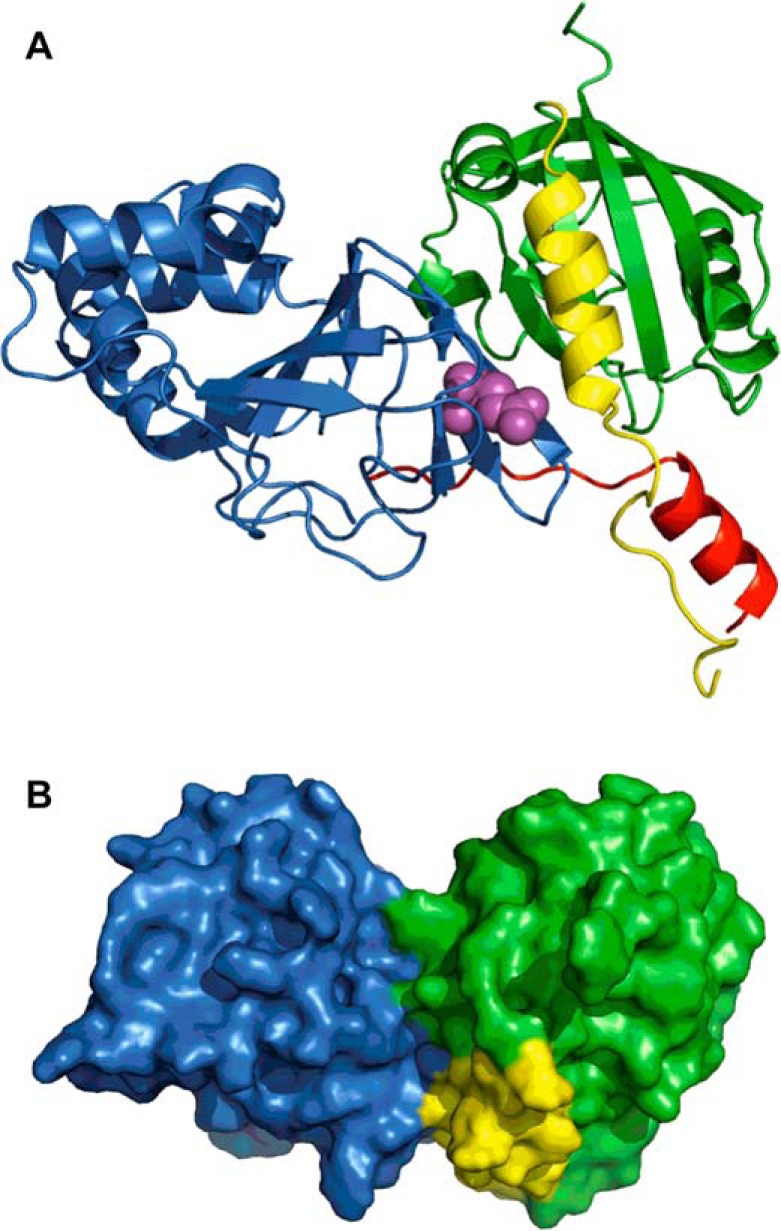
FIGURE 7. Molecular model of interactions between cNBHD and PAS-cap of hEAG1.
A, homology model of the eagD-cNBHD complex based upon the crystal structure (Protein Data Bank code 4LLO (25)). The PAS-cap is shown in yellow, the PAS domain in green, the cNBHD in blue, and the post-cNBHD region in red. The side chain of Glu-600 is shown in spheres and colored magenta. B, homology model rotated around the horizontal axis by ∼90° with surface rendering to illustrate how the amphipathic α-helix of the PAS-cap sits between the PAS domain and cNBHD. Colors correspond to A. Image published in: Lörinczi E et al. (2016) © 2016 by The American Society for Biochemistry and Molecular Biology, Inc. Creative Commons Attribution license Larger Image Printer Friendly View |