XB-IMG-122207
Xenbase Image ID: 122207

|
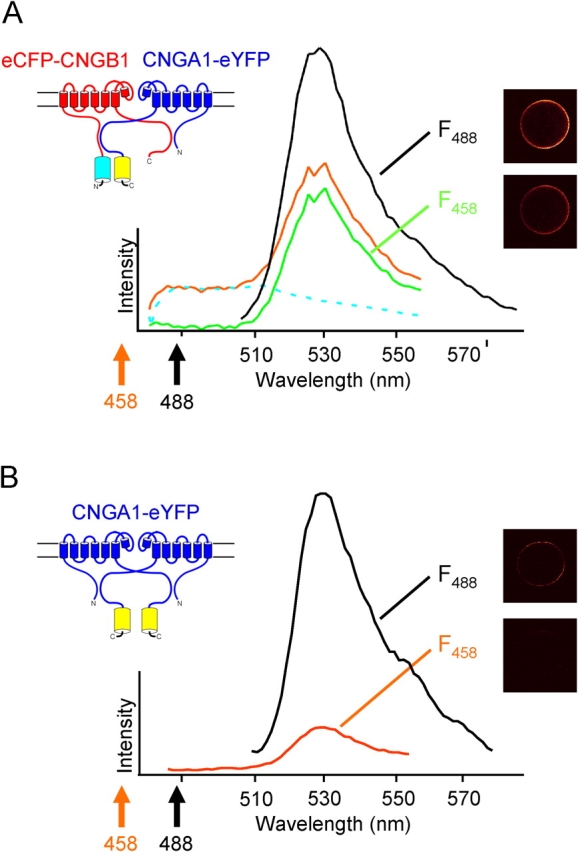
Figure 4. . Proximity of the NH2-terminal region of CNGB1 and the COOH-terminal region of CNGA1. (A) Spectral method for determining FRET and Ratio A. Emission spectra from whole oocytes were taken from CNGA1-eYFP/eCFP-CNGB1 channels with eCFP attached to the NH2-terminal region of CNGB1 and eYFP attached to the COOH-terminal region of CNGA1 (as in the cartoon) with excitation by a 458-nm laser (red line). The eCFP-only spectra (dotted, cyan line) was determined in a separate experiment with channels that contained only eCFP. The extracted F458 spectra (green line) is the red minus the cyan trace. F488 (black line) is the eYFP emission with excitation by a 488-nm laser. Ratio A was calculated as the F458 spectra normalized by the F488 spectra. (B) Determination of Ratio A0. In a control experiment with CNG channels containing only eYFP (cartoon) we determined the emission spectra from eYFP with excitation at 458 nm, F458 (red trace), and the emission spectra with excitation at 488 nm, F488 (black trace). Ratio A0 was calculated as the F458 spectra normalized by the F488 spectra in channels containing only eYFP. Image published in: Trudeau MC and Zagotta WN (2004) Copyright © 2004, The Rockefeller University Press. Creative Commons Attribution-NonCommercial-ShareAlike license Larger Image Printer Friendly View |
