XB-IMG-119136
Xenbase Image ID: 119136
|
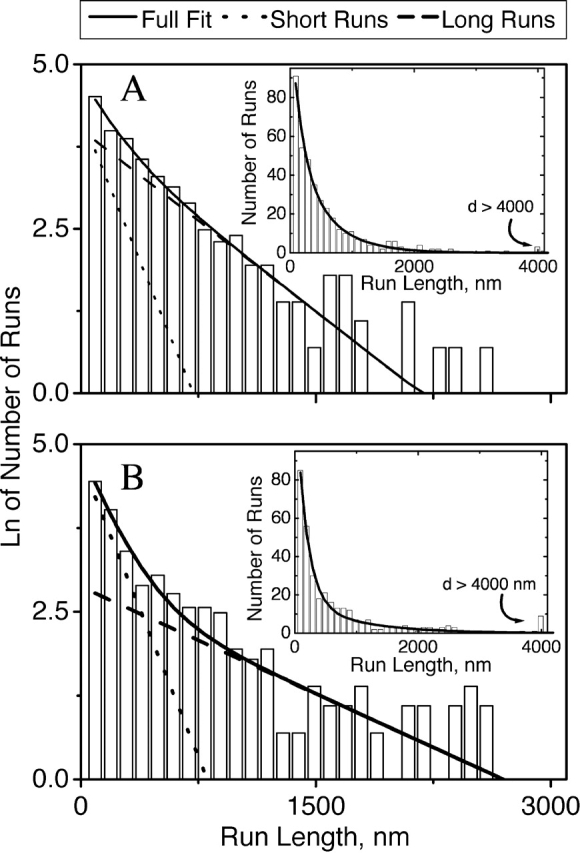
Figure 7. Distribution of run lengths for minus end motion in wild-type (A) and myosin V (B) cells stimulated with MSH. Individual run lengths were determined as described in Materials and methods. In all cases examined, the distribution was well described by the sum of two decaying exponentials (Table I). The original histogram (bars) together with the double-decaying exponential fit (solid line) is shown in the inserts. Note that there are relatively more long runs in the myosin V cells (B) than in wild-type cells (A). The full graphs show the natural logarithm of the number of runs versus run length. The solid line is the complete fit, whereas the dotted and dashed lines indicate the contributions of the short and long runs, respectively. The long runs (tail of the distribution) are significantly altered due to myosin V activity, but the short runs are not (compare the slope of the long-runs line in A and B). Image published in: Gross SP et al. (2002) Copyright © 2002, The Rockefeller University Press. Creative Commons Attribution-NonCommercial-ShareAlike license Larger Image Printer Friendly View |