XB-IMG-125070
Xenbase Image ID: 125070
|
|
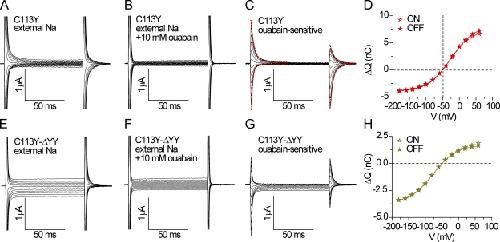
Figure 8. Representative ouabain-sensitive pre–steady-state currents under Na/Na exchange conditions for C113Y and C113Y-ΔYY pumps. (A–D) C113Y pumps; (E–H) C113Y-ΔYY pumps. Superimposed current records obtained in 125 mM Nao before (A, C113Y; E, C113Y-ΔYY) and after (B, C113Y; F, C113Y-ΔYY) adding 10 mM ouabain. Ouabain-sensitive transient currents determined by direct subtraction of the records in A and B and in E and F, respectively, are shown in C for C113Y and in G for C113Y-ΔYY Na/K pumps (red lines in C show single exponential fits to ON and OFF transient currents elicited by steps to 60 mV and −180 mV for relaxation rate estimates of Fig. 9 [C and D]). Pre–steady-state charge was obtained directly as the time integral of the transient currents (C and G) at the ON and OFF voltage steps after baseline subtraction of any steady current. (D and H) The charge–voltage distributions were fit with the Boltzmann relationQ(V)=Qmax+(Qmin−Qmax)1+e[zqF(V−V0.5)/RT],where V is the test voltage, Qmin and Qmax are the charge moved for extreme negative and positive voltage steps, zq is the effective charge, V0.5 is the midpoint voltage, and F, R, and T have their usual meaning. ON and OFF values are, respectively, for D as follows: Qmin, −4.0 nC and −3.9 nC; Qmax, 7.5 nC and 8.2 nC; zq, 0.74 and 0.71; V0.5, −29 mV and −25 mV. ON and OFF values are, respectively, for H as follows: Qmin, −3.8 nC and −3.7 nC; Qmax, 1.9 nC and 1.7 nC; zq, 0.66 and 0.69; V0.5, −74 mV and −77 mV. Image published in: Vedovato N and Gadsby DC (2010) © 2010 Vedovato and Gadsby. Creative Commons Attribution-NonCommercial-ShareAlike license Larger Image Printer Friendly View |