XB-IMG-123231
Xenbase Image ID: 123231
|
|
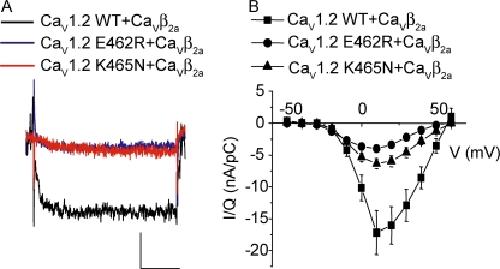
Figure 9. Single channel mean currents and I/Q plots from macroscopic currents from different CaV1.2 variants recorded in high Ba2+ and S(-)Bay K8644. (A) Mean current traces for six patches containing single CaV1.2 WT/CaVβ2a channels (black) from seven patches with CaV1.2 E462R/CaVβ2a channels (blue), and from 6 with CaV1.2 K465N/CaVβ2a channels (red). The number of traces averaged in each case was 4,032 for CaV1.2 WT/CaVβ2a, 7,504 for CaV1.2 E462R/CaVβ2a, and 6,104 for CaV1.2 K465N/CaVβ2a. Voltage protocol and recording condition were as described in Fig 7. Calibration bars correspond to 50 ms and 100 fA. (B) I/Q versus voltage plot for CaV1.2 WT (n = 12), CaV1.2 E462R (n = 12), and CaV1.2 K465N (n = 13) coexpressed with CaVβ2a and recorded in external 76 mM Ba2+ and 0.1 μM of S(-) Bay K 8644 as used for single channel. Image published in: Gonzalez-Gutierrez G et al. (2008) © 2008 Gonzales-Gutierrez et al. Creative Commons Attribution-NonCommercial-ShareAlike license Larger Image Printer Friendly View |