XB-IMG-125551
Xenbase Image ID: 125551
|
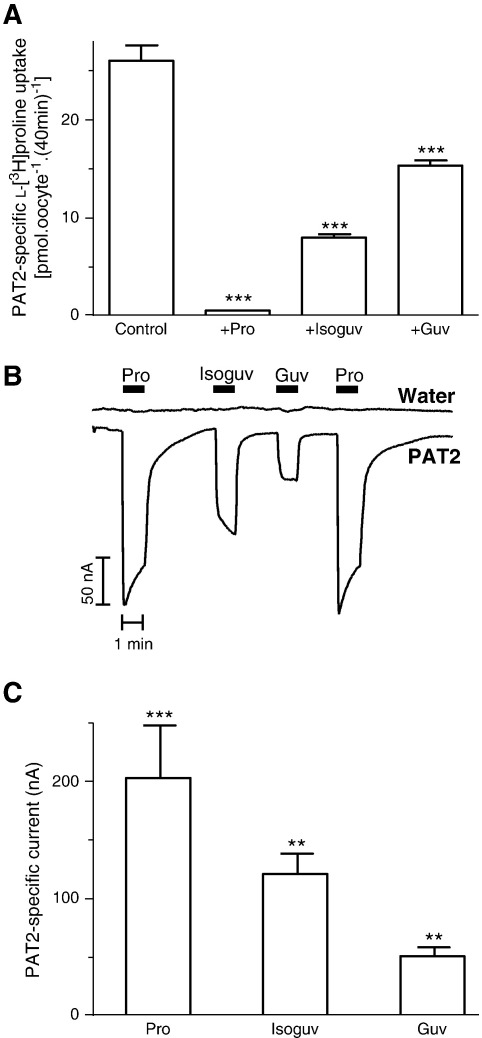
Fig. 4. Interaction of guvacine and isoguvacine with PAT2. A. l-[3H]Proline (10 μM) uptake (pH 5.5, Na+-free) was measured in the absence (control) and presence of proline (Pro), isoguvacine (Isoguv) and guvacine (Guv) (all 10 mM). Data are mean ± SEM (n = 20). ***, p < 0.001, versus control. B. Representative current trace observed using PAT2-expressing and water-injected oocytes during exposure to proline (Pro), isoguvacine (Isoguv) and guvacine (Guv) (all 10 mM). C. Mean data for part B showing PAT2-specific currents. Data are mean ± SEM (n = 4). ***, p < 0.001; **, p < 0.01, versus water-injected oocytes. Image published in: Edwards N et al. (2011) © 2011 Elsevier B. Creative Commons Attribution license Larger Image Printer Friendly View |