XB-IMG-122546
Xenbase Image ID: 122546

|
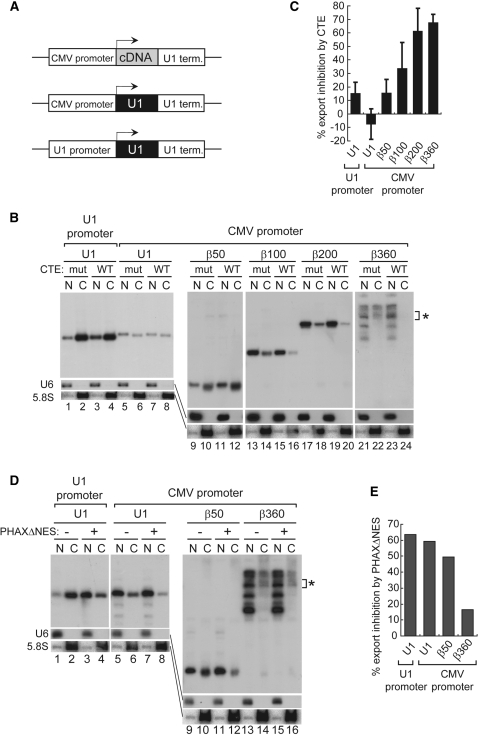
Figure 4. Effect of transcription from the CMV promoter on RNA export. (A) Diagram of the DNA constructs. Human β-globin cDNA fragments of various lengths or the U1ΔSm sequence were cloned between the CMV promoter and U1 terminator. The U1ΔSm gene was also used as a control. (B) Export of the transcripts produced from the microinjected plasmids harboring the cDNA fragments of various lengths (50–360 nt) or the U1ΔSm sequence between the CMV promoter and the U1 terminator was analyzed as in Figure 1B. The U1ΔSm gene was also used as a control. The bands indicated by the asterisk correspond to the 360 nt transcript whose 3′-end was properly formed. (C) Quantitation of RNA export inhibition by CTE WT from experiments like those shown in B. Since the β360 construct produced multiple bands for unknown reason, the bands near the expected size were quantified (B, asterisk). (D) Export of the transcripts produced from the microinjected plasmids harboring the cDNA fragments of 50 or 360 nt or the U1ΔSm sequence between the CMV promoter and the U1 terminator was analyzed as in Figure 1D. The U1ΔSm gene was also used as a control. The bands shown by the asterisk correspond to the 360 nt transcript whose 3′-end was properly formed. (E) Quantitation of RNA export inhibition by PHAXΔNES from the experiment shown in D. Since the β360 construct produced multiple bands, the bands near the expected size were quantified (D, asterisk). Image published in: Fuke H and Ohno M (2008) © 2007 The Author(s). Creative Commons Attribution-NonCommercial license Larger Image Printer Friendly View |
