XB-IMG-154315
Xenbase Image ID: 154315
|
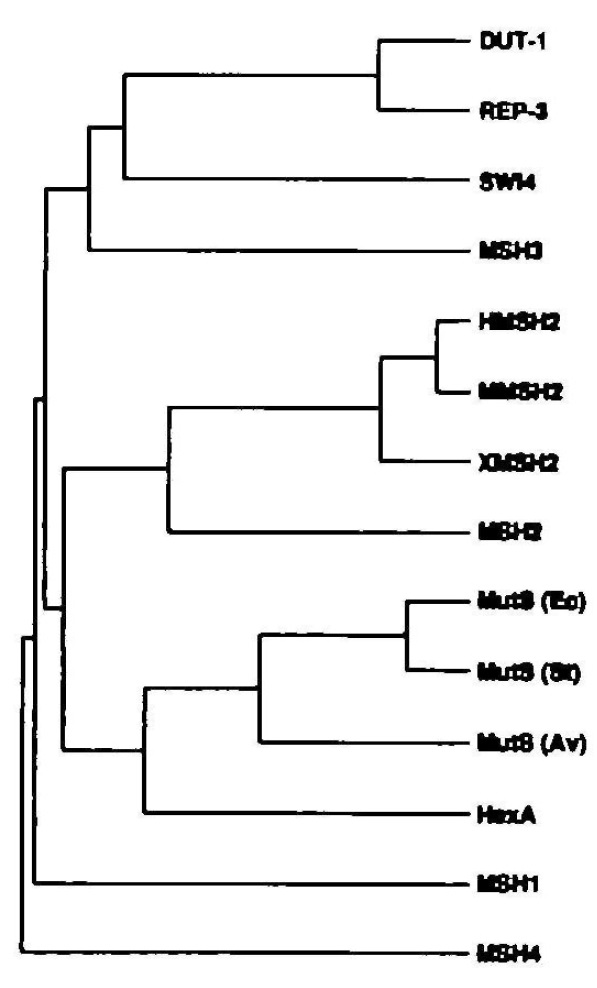
Figure 4. Dendogram showing clustering relationships between rhe different MSH
proteins, generated with the PILEUP program (37). Abbreviations are as follows:
DUT-1: human DUT-1 (22), REP-3: mouse Rep-3 (21), SW14: S.pombe SW14
(20), MSH3: S.ccre\isiae MSH3 (11. 12), HMSH2: human HMSH2 (25. 26).
MMSH2: mouse MMSH2, XMSH2: Xenopus XMSH2, MSH2: S.cerevisiae
MSH2 (10), MutS (Ec). E.coli MutS (51), MutS (St): S.typhimurium MutS (52),
MutS (Av): Azotobacter vinelandu MutS (53), HexA- S.pnaanoniae HexA (54),
MSH1: S.cerevisiae MSH1 (10) and MSH4: S.cerevisiae MSH4 (23). Image published in: Varlet I et al. (1994) Copyright © 1994. Image reproduced with permission of the Publisher and the copyright holder. This is an Open Access article distributed under the terms of the Creative Commons Attribution License. Larger Image Printer Friendly View |