XB-IMG-123112
Xenbase Image ID: 123112
|
|
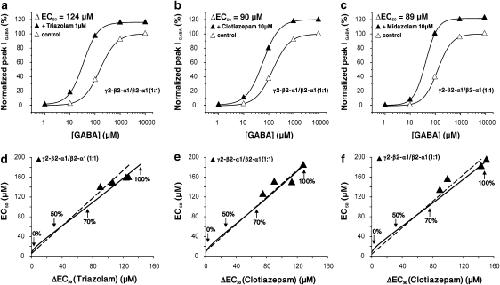
Figure 4. GABA concentration–response curves of oocytes injected with concatenated subunits (γ2-β2-α1/β2-α1) in the absence (control) and presence of 1 μM triazolam (a), 10 μM clotiazepam (b) and 10 μM midazolam (c). The corresponding EC50 values were: 158 μM (control), 34 μM (triazolam); 150 μM (control), 60 μM (clotiazepam); 132 μM (control), 43 μM (midazolam). EC50 values of the GABA concentration–response curves of oocytes expressing concatenated subunit constructs (γ2-β2-α1 and β2-α1 in 1:1 ratio) and ΔEC50(BZD)s induced by (d) 1 μM triazolam, (e) 10 μM clotiazepam and (f) 10 μM midazolam were added to the regression lines from Figures 2d–f. Corresponding regression lines (dashed) were taken from Figures 2d–f and extended towards the values of the concatenated subunits. Solid lines (d–f) represent the non-linear fit of Equations 1–5 (see Materials and methods) by the maximal likelihood. Calculated current fractions of γ-incorporating receptors (0, 50, 70 and 100%) are indicated. Each graph (a, b and c) and each data point (d, e and f) represent one experiment on one oocyte. Image published in: Baburin I et al. (2008) Copyright 2008, Macmillan Publishers Limited. Creative Commons Attribution-NonCommercial-NoDerivatives license Larger Image Printer Friendly View |