XB-IMG-125307
Xenbase Image ID: 125307
|
|
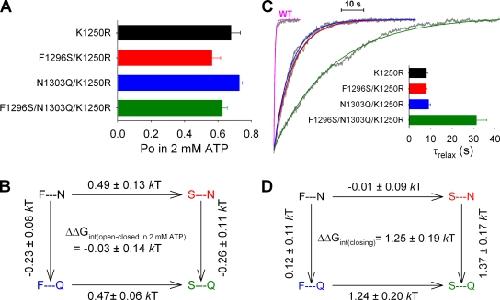
Figure 5. Energetic coupling between sites 1 and 2 changes between ATP-bound open and ATP-free closed states, but not between ATP-bound closed and open states. (A) Summary of Po;max values for K1250R (black), F1296S/K1250R (red), N1303Q/K1250R (blue), and F1296S/N1303Q/K1250R (green) obtained from the data presented in Fig. 4 B. (B) Thermodynamic mutant cycle built on Po;max/(1−Po;max) values showing changes (mean ± SEM) in the stability of the open state with respect to the closed state in saturating ATP. (C) Time courses of macroscopic current decay upon sudden washout of 2 mM ATP (gray traces), and mono-exponential fit lines (color-coded as in A; the red and black fit lines overlap). The trace for WT (labeled), shown as a comparison, is fitted with a single exponential (magenta) with a time constant of 459 ms. (Inset) Mean (±SEM) closing time constants (τrelax) obtained from 7–22 similar experiments for each construct. (D) Thermodynamic mutant cycle built on macroscopic relaxation rates (1/τrelax). Image published in: Szollosi A et al. (2010) © 2010 Szollosi et al. Creative Commons Attribution-NonCommercial-ShareAlike license Larger Image Printer Friendly View |