XB-IMG-121081
Xenbase Image ID: 121081
|
|
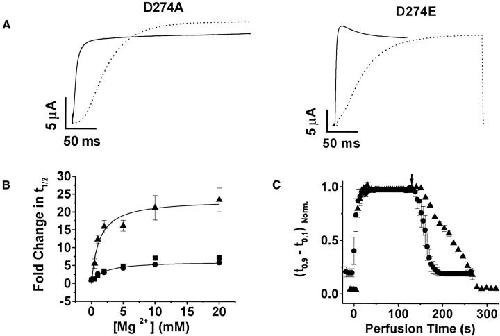
Figure 6. D274 mutants retain Mg2+ sensitivity. (A) Representative current traces for D274A (left) and D274E (right) are shown. From a holding potential of −80 mV, test pulses to +60 mV were applied in the absence (solid lines) or presence (dashed lines) of 10 mM Mg2+. (B) Values of t1/2 at +60 mV for D274A (▪), D274E (▴), and wild type (•) were measured in various concentrations of Mg2+ up to 20 mM, expressed as fold change in t1/2, and plotted as a function of Mg2+ concentration. Values are shown as mean ± SEM, n = 3–5. Half maximal Mg2+ concentrations, estimated by fitting rectangular hyperbolae (solid curves) to the data, were 3.5 mM for wild type and 1.2 mM for D274E. (C) Activation kinetics recover from Mg2+ more slowly in D274E channels than in wild-type eag. Cells expressing D274E and wild-type channels were subjected to continuous perfusion and held at −90 mV, with 400 ms test pulses to +60 mV applied at 4.5 s intervals during wash in for both wild type and D274E, and at 4.5 or 9.5 s intervals for wild type and D274E, respectively, during recovery. After establishing a baseline in the absence of Mg2+, cells were perfused with extracellular solution containing 20 mM Mg2+ beginning at t = 0, followed by perfusion of the Mg2+-free solution, beginning at the time indicated by the arrow. Activation kinetics were quantified by measuring the time interval between 10 and 90% of maximal current amplitude. This value was normalized to the longest interval (i.e., slowest kinetics), and plotted as a function of perfusion time. Values for wild type (•) and D274E (▴) are shown as mean ± SEM, n = 5. Image published in: Silverman WR et al. (2000) © 2000 The Rockefeller University Press. Creative Commons Attribution-NonCommercial-ShareAlike license Larger Image Printer Friendly View |