XB-IMG-128275
Xenbase Image ID: 128275
|
|
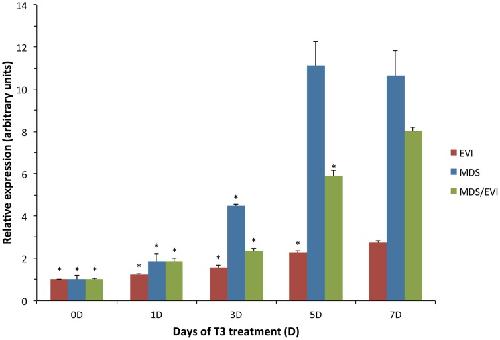
Figure 3. EVI, MDS, and MDS/EVI transcripts are induced in the intestine of premetamorphic tadpoles treated with T3.The expression of the transcripts was analyzed by using transcript-specific primer sets (as in Fig. 2.) on total intestinal RNA from tadpoles at stage 54 exposed to 5 nM T3 for 0–7 days. Error bars indicate SEM (n = 3). * indicates transcript levels lower than the peak expression of the specific transcript (p≤0.05). Image published in: Miller TC et al. (2013) Image downloaded from an Open Access article in PubMed Central. Image reproduced on Xenbase with permission of the publisher and the copyright holder. Larger Image Printer Friendly View |