XB-IMG-121106
Xenbase Image ID: 121106
|
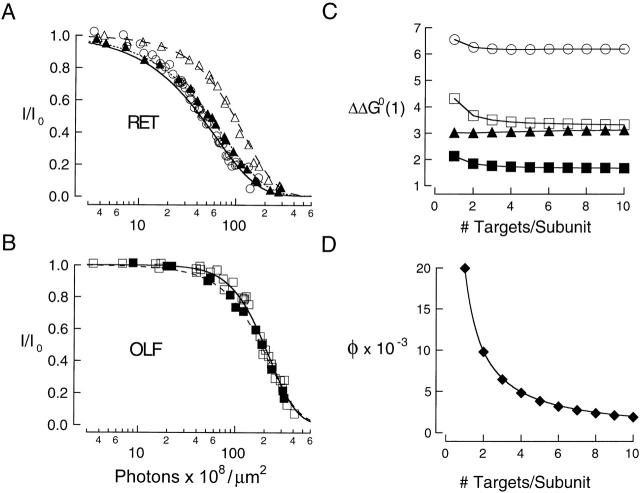
Figure 9. Modeling of UV effect on CNG channel currents. (A and B) UV dose–response relations for: (A) RET and (B) OLF channels. Results are the same as in Fig. 8A and Fig. B. Relations were fit using the energy additive model () for all possible values of n, the number of UV target residues per channel subunit. The continuous curves show fits for n = 2; excellent fits (not shown) were also obtained for 3 ≤ n ≤ 10. The free energy cost of target modification, ΔΔG 0(1), was allowed to vary for the different channel/ligand pairs. The photochemical quantum yield, φ, was constrained to be the same for RET and OLF channels for all conditions studied. ΔG 0(0) values used in the fits are given in Table . (C) Free energy cost for target modification in CNG channels. ΔΔG 0(1) values obtained from the fits in A and B are plotted as a function of n. The solid lines connect the points. The average values of ΔΔG 0(1) for 2 ≤ n ≤ 10 (RT units) were: for RET/cGMP (○), 6.19 ± 0.03; for OLF/cGMP (□), 3.41 ± 0.11; for RET/cAMP (▴), 3.07 ± 0.04; and for OLF/cAMP (▪), 1.72 ± 0.05. (D) Quantum yield for target modification in CNG channels. Quantum yields (♦), obtained from the fits in A and B are plotted as a function of n. The smooth curve is a fit to the results using the relation φ = B/n, with the constant B = 0.02. Image published in: Middendorf TR and Aldrich RW (2000) © 2000 The Rockefeller University Press. Creative Commons Attribution-NonCommercial-ShareAlike license Larger Image Printer Friendly View |