XB-IMG-170036
Xenbase Image ID: 170036
|
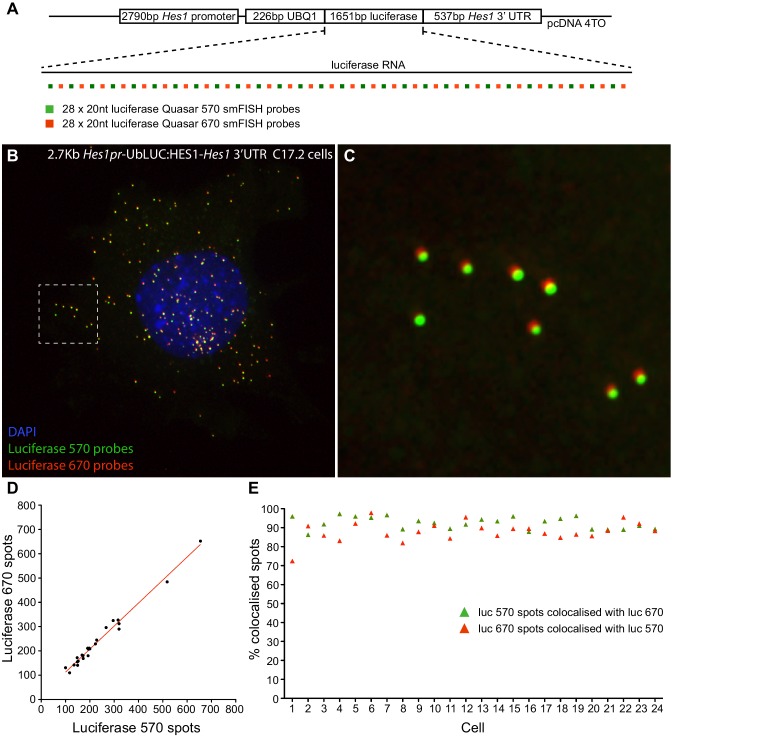
Figure 1—figure supplement 2. Validation of smFISH accuracy.(A) To test the reliability of smFISH for accurate single-cell RNA quantification, we analysed spot number detected by two interleaved smFISH probe sets (each comprising 28 x 20 nt probes), targeting luciferase RNAs expressed from a 2.7 kb-Hes1pr-UbLUC:HES1–Hes1 3’UTR construct stably transfected into C17.2 cells (generated in Goodfellow et al. [Goodfellow et al., 2014]). (B) Luciferase Quasar 570 and Quasar 670 smFISH probes simultaneously hybridized to luciferase RNAs in a C17.2 cell. (C) Zoom panel of the region highlighted in B, showing colocalisation of smFISH spots detected with each probe set; there is a slight chromatic shift between channels. (D) smFISH spots detected by each probe set were quantified in 24 cells using the 'analyze spots' function in Imaris. Linear regression analysis confirmed strong agreement in the RNA number detected by each probe set (slope = 0.95 ± 0.03, R2 = 0.98). (E) To test that the probe sets detected the same RNAs, colocalisation of detected spots was analysed between the two channels. A correction was applied in x, y and z to account for the chromatic shift between channels, then the Imaris XTension 'Spots Colocalize' was performed using a distance of 0.5 μM. This returned 92.5% colocalisation of Quasar 570 spots with Quasar 670 spots, and 88.0% colocalisation of Quasar 670 spots with Quasar 570. smFISH count data contained in Figure 1—source data 3.DOI:
http://dx.doi.org/10.7554/eLife.16118.009 Image published in: Phillips NE et al. (2016) © 2016, Phillips et al. Creative Commons Attribution license Larger Image Printer Friendly View |