XB-IMG-136669
Xenbase Image ID: 136669

|
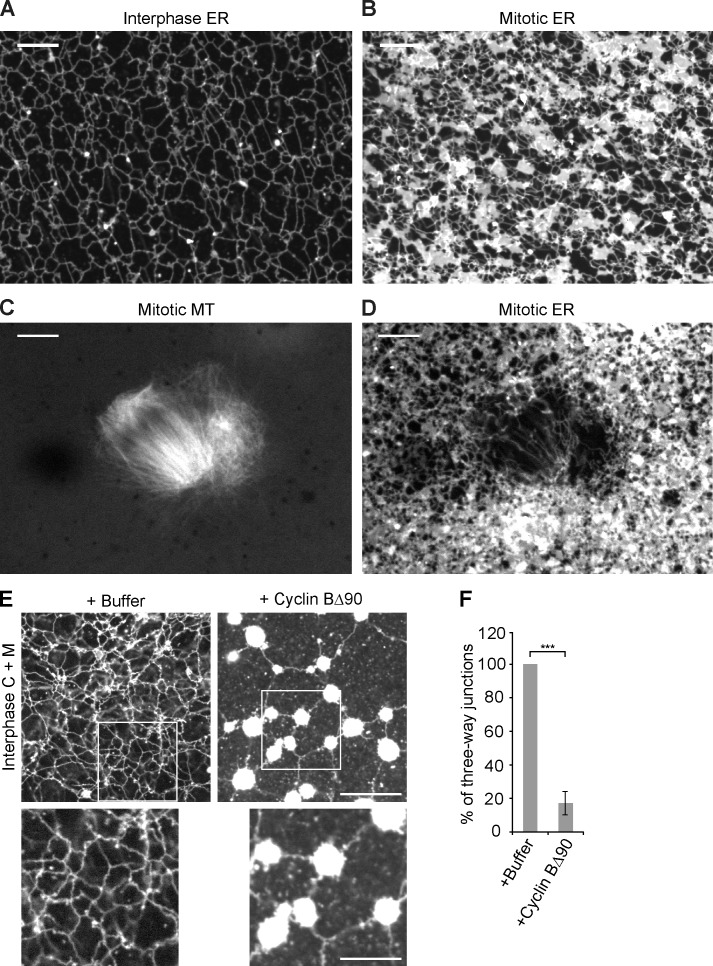
Figure 4. The ER network undergoes tubule-to-sheet conversion during the transition from interphase to meiosis and mitosis. (A) A crude CSF extract was driven into interphase by addition of Ca2+ ions. The ER network was stained with the hydrophobic dye DiIC18 and visualized by confocal fluorescence microscopy. Bar, 10 µm. (B) As in A, but the meiotic (CSF) state of the extract was maintained by omitting Ca2+. Bar, 20 µm. (C and D) As in B, but with addition of demembranated sperm. C shows the MTs stained with Alexa fluor 488–labeled tubulin, and D shows the membranes stained with DiIC18. Bars, 10 µm. (E) Interphase cytosol, light membranes, and an energy regenerating system were mixed with cyclin BΔ90 to generate a mitotic state. A control was performed with buffer. The membranes were stained with octadecyl rhodamine and visualized by confocal microscopy. The bottom panels show magnified views of the three-way junctions highlighted in the boxed area. Bars: (top) 20 µm; (bottom) 10 µm. (F) The number of three-way junctions in E was counted and expressed as a percentage of the control. The data plotted are the mean ± SD of three independent experiments. ***, P < 0.001, Student’s t test. Image published in: Wang S et al. (2013) © 2013 Wang et al. Creative Commons Attribution-NonCommercial-ShareAlike license Larger Image Printer Friendly View |
