XB-IMG-130138
Xenbase Image ID: 130138

|
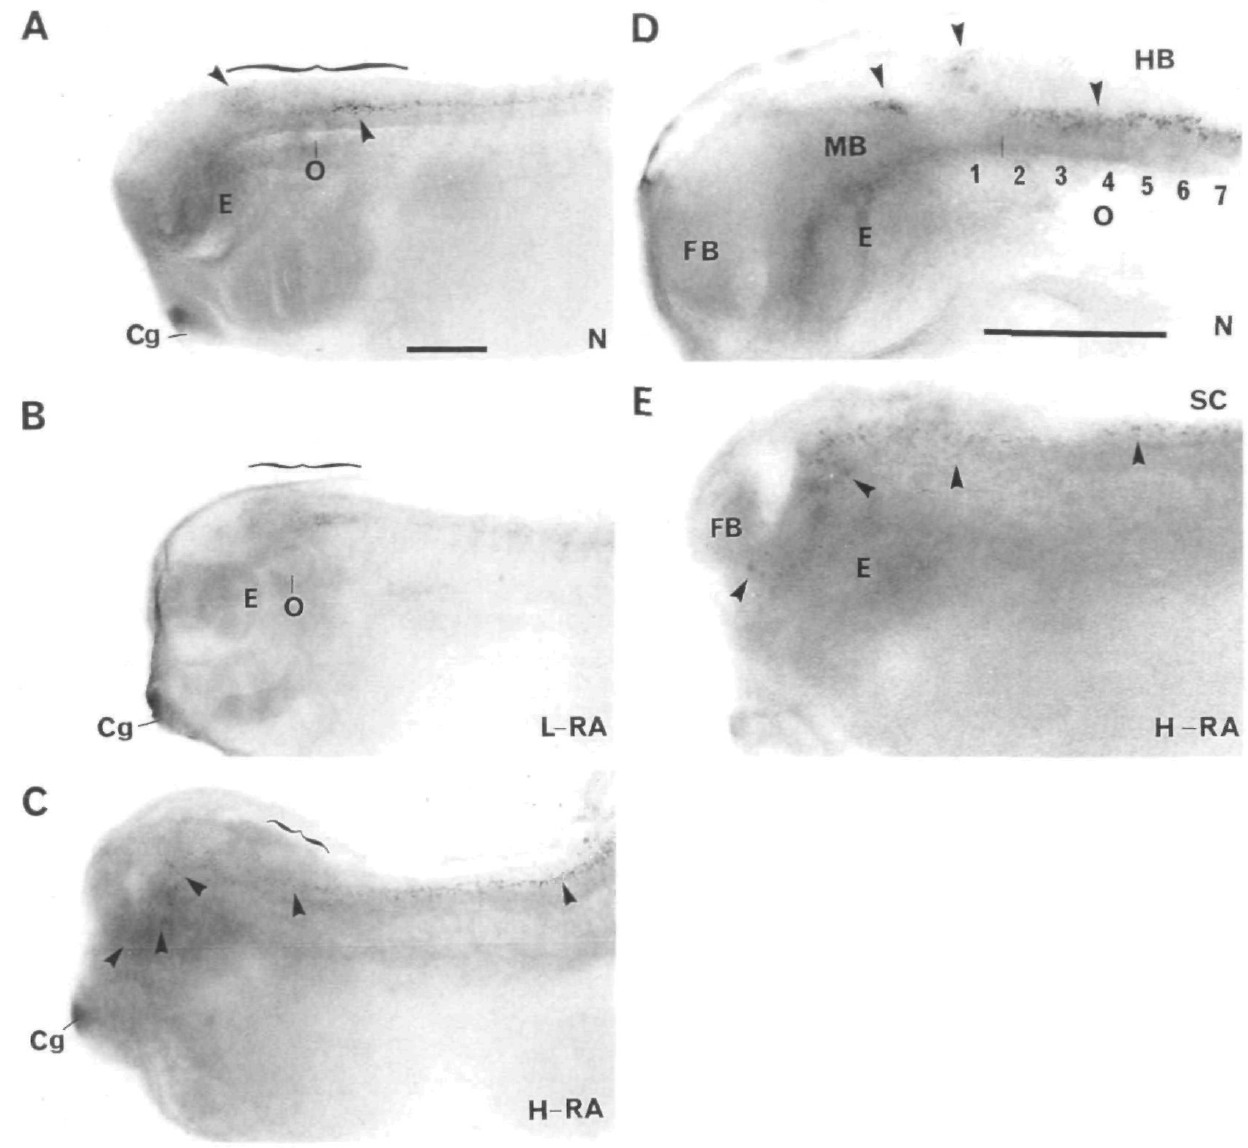
Fig. 3. Expression patterns of the homeobox protein Xhox3 in control and RA-treated tadpole stage embryos. (A) At the
early tadpole stage, Xhox3 is expressed in the dorsal-anterior hindbrain, mainly in rhombomere 1 and in a more ventral
column of cells in the spinal cord and hindbrain that extends rostrally up to the boundary between rhombomeres 1 and 2.
Within this ventral column, the expression of Xhox3 is highest in rhombomeres 5 and 6 (arrowhead in panel A).
(B) Treatment of early neurula stage embryos with low concentrations of RA results in the reduction of the size of the
hindbrain. This is manifest as a reduction in the distance between the eye and the otic vesicle (in focus), the eye and cells
expressing Xhox3 dorsally in the anterior hindbrain and the eye and cells expressing Xhox3 at high levels normally found
in rhombomeres 5 and 6 (slightly out of focus). (D) In older tadpoles, Xhox3 is also expressed in a small group of cells in
the lateral midbrain. (C,E) Embryos treated with high concentrations of RA lack the expression of Xhox3 in the midbrain
as well as any dorsal expression in the hindbrain but show ectopic expression of Xhox3 in the ventral anterior regions of
the CNS, including the forebrain. Treatment with high concentrations of RA causes a reduction in the size of the CNS
although the forebrain, midbrain and hindbrain sudbivisions can still be distinguished. High magnifications of the brains of
control (D) and RA-treated embryos (E) show the changes in morphology and Xhox3 immunoreactivity in the anterior
regions of the CNS. Only a few positive nuclei can be observed in panel E since at this magnification, few cells are in the
plane of focus. E, eye; FB, forebrain; HB, hindbrain; MB, midbrain; N, untreated control embryos; o, otic vesicle; RA,
embryos treated with low (L-RA) or high (H-RA) concentrations of RA; SC, spinal cord; arrowheads point to regions or
cells showing nuclear Xhox3 labelling; numbers identify rhombomeres. Brackets depict the hindbrain in panels A-C. Scale
bar=0.5mm. Scale bar in panels A and D are valid for panels A-C and D-E, respectively. Image published in: Ruiz i Altaba A and Jessell TM (1991) Copyright © 1991. Image reproduced with permission of the Publisher and the copyright holder. This is an Open Access article distributed under the terms of the Creative Commons Attribution License.
Image source: Published Larger Image Printer Friendly View |
