XB-IMG-120116
Xenbase Image ID: 120116
|
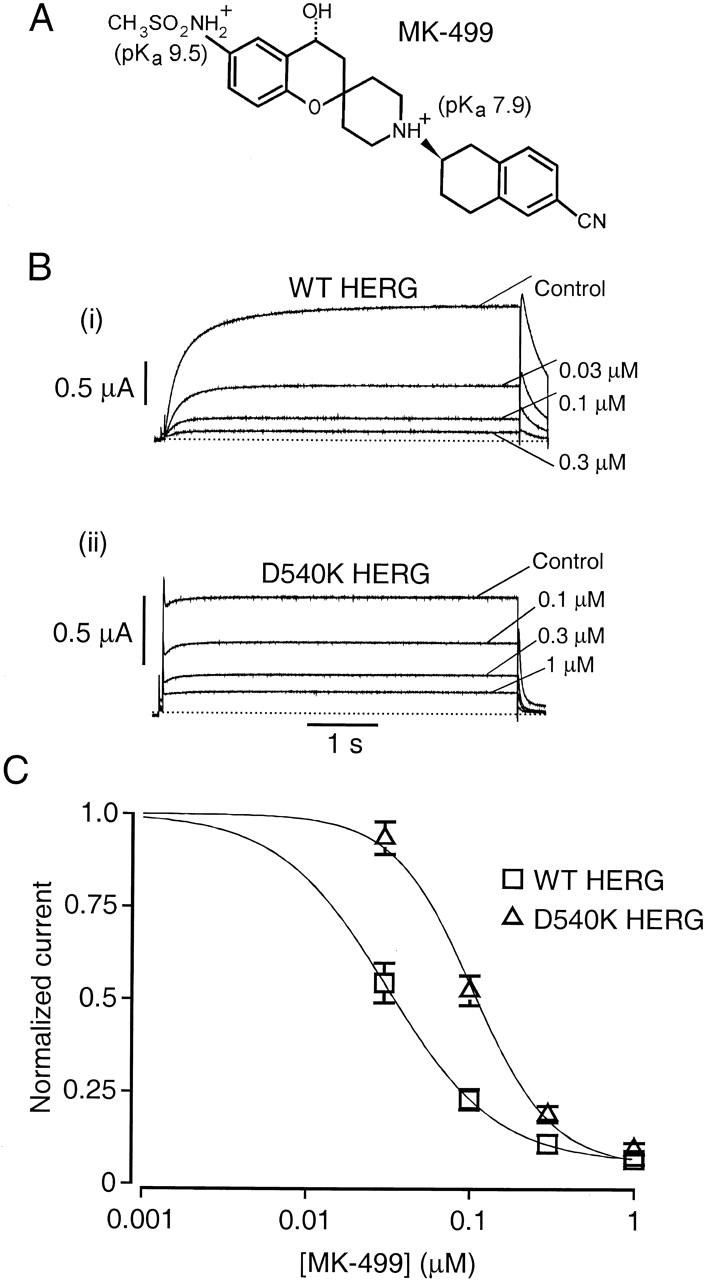
Figure 6. Concentration-dependent block of HERG by MK-499. (A) Structure of MK-499 showing pKa values for nitrogen groups. (B) Examples of WT (i) and D540K HERG (ii) currents before and after exposure of oocytes to solutions containing various concentrations of MK-499. From a holding potential of −90 mV, currents were recorded during 5-s pulses to 0 mV; tail currents were recorded at −70 mV. (C) Concentration-response relationships for block of WT and D540K HERG current in oocytes. Steady state peak current amplitudes at 0 mV for each [MK-499] were normalized to control. Mean values were plotted against [MK-499] and fitted with the Hill equation. Mean IC50s were 32 ± 4 nM (Hill coefficient = 1; n = 4) for WT HERG and 104 ± 8 nM (Hill coefficient = 1.8; n = 5–7) for D540K HERG. Image published in: Mitcheson JS et al. (2000) © 2000 The Rockefeller University Press. Creative Commons Attribution-NonCommercial-ShareAlike license Larger Image Printer Friendly View |