XB-IMG-128814
Xenbase Image ID: 128814
|
|
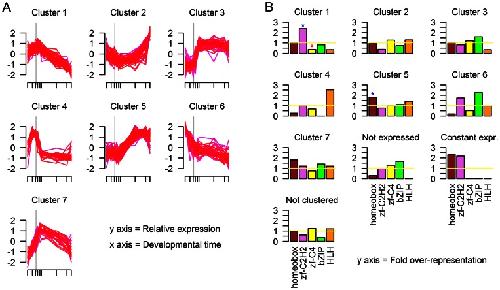
Figure 3. Clustering of transcription factor expression patterns in C. elegans.(a) The expression patterns of members of each of the seven clusters determined by Mfuzz. The gray vertical line indicates the onset of gastrulation. (b) The relative representation of different TF families in each cluster. Blue stars signify statistically significant over-representation of a TF family in a cluster; red stars signify statistically significant under-representation of a TF family in a cluster. Image published in: Schep AN and Adryan B (2013) Image reproduced on Xenbase with permission of the publisher and the copyright holder. Creative Commons Attribution license Larger Image Printer Friendly View |