XB-IMG-128601
Xenbase Image ID: 128601
|
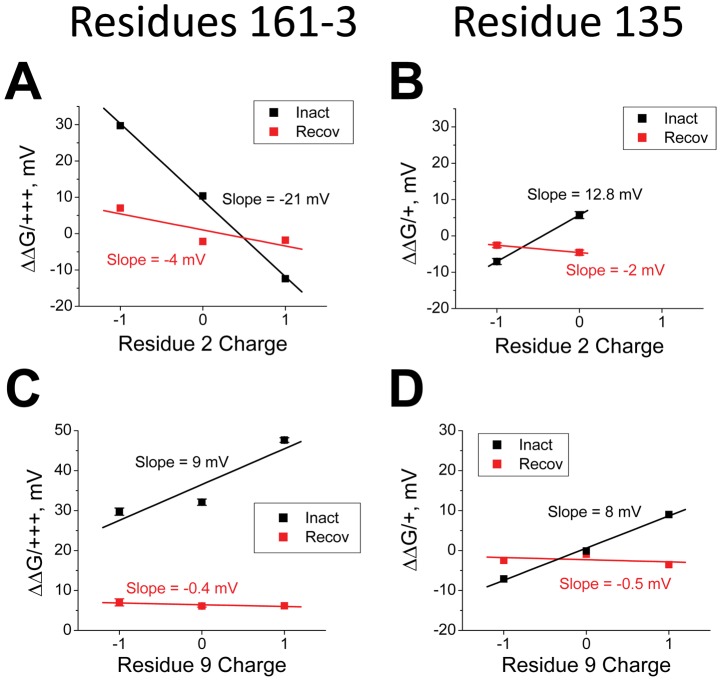
Figure 8. Summary Plots of Electrostatic Coupling of Residues 2 and 9 with the Channel Core Resides 161-3 and 135.Slopes of linear fits to curves in Figs. 6, 7 are plotted versus the charge at positions 2 and 9. A) Residue 2 shows a large counterintuitive effect where making 161–3 more positive changes the potential experienced by residue 2 during the rate limiting ON transition by −21 mV. This suggests that residue 2 is net moving away from 161–3 to reach Threshold. Recovery shows only a small coupling of −4 mV suggesting that more positive charges at 161–3 stabilize a negative charge at position 2 in the pore Binding site by 4 mV relative to an uncharged residue. B) Residue 2 experiences a 12.8 mV more positive potential during the rate limiting transition as residue 135 is made more positive. There is a small −2 mV coupling of 135 charge to residue 2 in the pore binding site, suggesting a small stabilization is residue 2 is negatively charged. C) For residue 9, more positive charges at residue 161–3 increase the electrostatic potential experienced by residue 2 at the Transition state by 9 mV. There is little impact of changing the charge at 161–3 on recovery that is transmitted through the charge at position 9. D) More positive charge at 135 similarly increases the electrostatic potential experienced by residue 2 at the Transition state by 8 mV. There is little impact of changing the charge at 135 on recovery that is transmitted through the charge at position 9. Image published in: Prince A and Pfaffinger PJ (2013) Image reproduced on Xenbase with permission of the publisher and the copyright holder. Creative Commons Attribution license Larger Image Printer Friendly View |