XB-IMG-124157
Xenbase Image ID: 124157

|
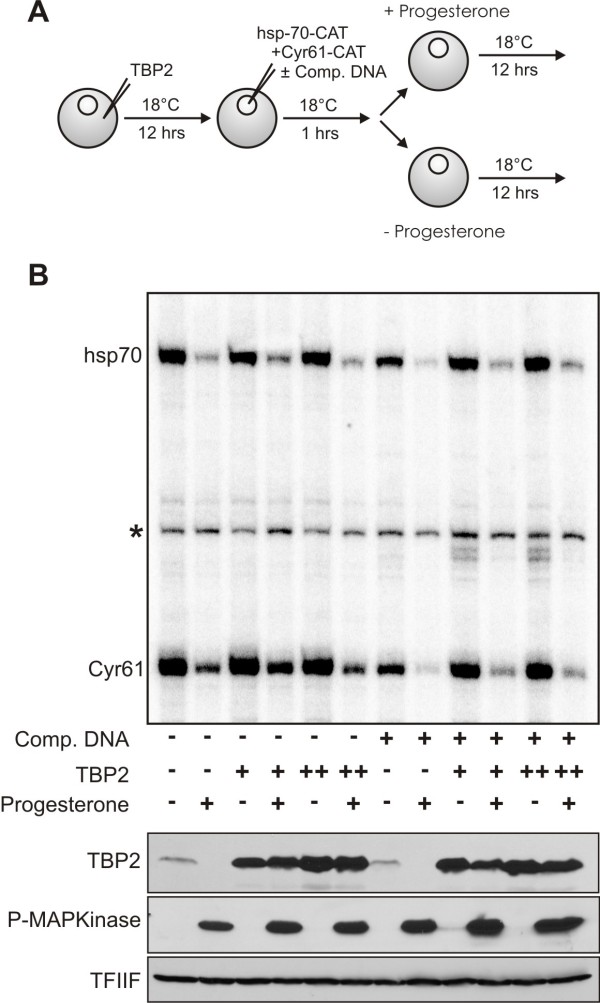
Figure 5. Transcription repression occurs in the presence of abundant TBP2. (A) A scheme of the experiment shown in (B) is presented. Either 2 ng or 4 ng of TBP2 mRNA was injected into stage VI oocytes. After a delay of 12 hr oocytes were injected in the nucleus with 1.0 ng of hsp70 and 0.5 ng of Cyr61 promoter constructs either with or without 18 ng of competitor DNA. One hour after the nuclear injections oocytes were divided into two groups. One group was treated with progesterone (final concentration 2 μg/ml). After a further incubation of 12 hr groups of 20 healthy oocytes were collected for RNA and protein analysis. (B) For transcription analysis, a primer extension was performed as described in Methods. The positions of accurately initiated transcripts from the hsp70 (hsp-70) and Cyr61 promoter (Cyr61) are indicated. The conditions used for each lane are described below the gel, and at the bottom expression of TBP2 has been shown for the corresponding lane. Phospho-MAPK was used as a marker for maturation while TFIIF served as a loading control. Image published in: Akhtar W and Veenstra GJ (2009) Copyright © 2009 Akhtar and Veenstra; licensee BioMed Central Ltd. Creative Commons Attribution license Larger Image Printer Friendly View |
