XB-IMG-121113
Xenbase Image ID: 121113
|
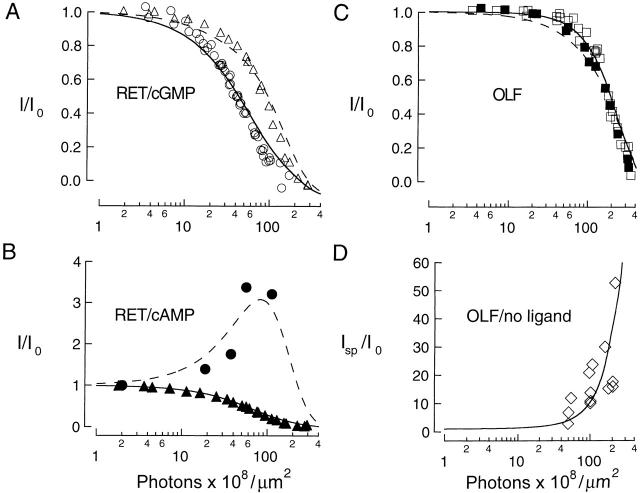
Figure 16. Analysis of UV effects on CNG channels using the expanded energy additive model. (A–D) UV dose–response relations for: (A) RET channels activated by saturating (1 mM) cGMP in the presence (▵) and absence (○) of 10 μM cytoplasmic Ni2+. (B) RET channels activated by saturating cAMP (1 mM) in the presence of 10 μM cytoplasmic Ni2+ (▴) and saturating (20 mM) cAMP in the absence of Ni2+ (•). (C) OLF channels activated by saturating (1 mM) cAMP (▪) and saturating (1 mM) cGMP (□). (D) OLF channels with no ligand present (⋄). The smooth curves show simultaneous fits to the results in A–D using the expanded energy additive model (). The fitted curves were calculated assuming three (+) targets and two (−) targets per channel subunit; however, the results were fit equally well for other target numbers. ΔG 0(0) values used in the fits are listed in Table . The quantum yield for each type of target was constrained to be the same for all channel/ligand combinations, and the values obtained from the fits were φ+ = 0.006 and φ− = 0.02. The free energy costs for modifying the (+) and (−) targets were allowed to vary for the different channel/ligand combinations. The values of ΔΔG 0(1+) and ΔΔG 0(1−) obtained from the fits were (RT units): for RET/cGMP, +8 and −0.95; for RET/cAMP, +7 and −0.95; for OLF/cGMP, +4.8 and −0.7; for OLF/cAMP, +3 and −0.7; and for OLF/no ligand, 0 and −0.7. Image published in: Middendorf TR and Aldrich RW (2000) © 2000 The Rockefeller University Press. Creative Commons Attribution-NonCommercial-ShareAlike license Larger Image Printer Friendly View |