XB-IMG-127418
Xenbase Image ID: 127418
|
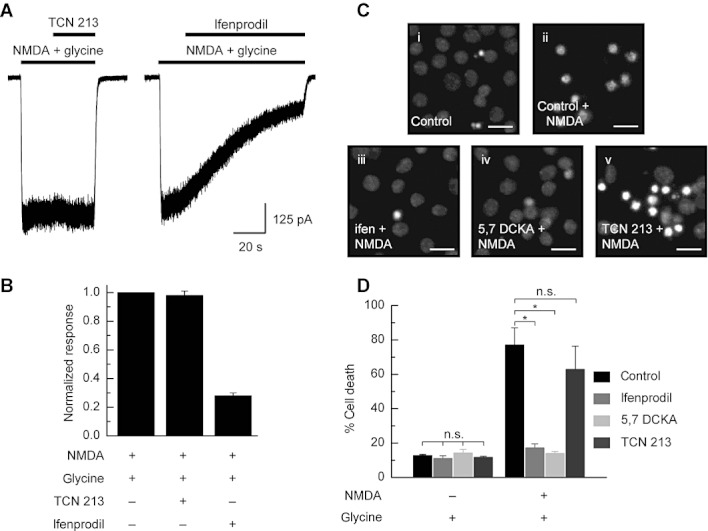
Figure 4. Activity of TCN 213 at native NMDA receptor-mediated responses in rat cortical cultures (DIV 7–9). (A) Whole-cell current recording made from a rat cortical pyramidal cell (7 DIV) and voltage-clamped at −70 mV. TCN 213 (10 µM) does not antagonize the NMDA (50 µM) + glycine (1.5 µM) evoked current, whereas ifenprodil (3 µM) reduces the current by around 75% indicating the presence of a large population of GluN1/GluN2B NMDA receptors in this neurone. (B) Bar graph summary (n= 12 cells) illustrating the mean TCN 213 and ifenprodil block of NMDA/glycine evoked currents. (C) Typical micrographs of neurones used to determine the extent of cell death elicited by each of the treatments. Note the high ratio of pyknotic nuclei compared with non-pyknotic nuclei when neurones are exposed to NMDA (40 µM) in the presence of TCN 213 (10 µM). Calibration bar 20 µm. (D) Summary of the percentage cell death observed in response to 1 h exposure to NMDA at the concentrations indicated (+1.5 µM glycine). Note the neuroprotective effects of the GluN1/GluN2B NMDA receptor selective antagonist, ifenprodil (3 µM) and the non-selective GluN1-site antagonist, 5,7 DCKA (10 µM). TCN 213 (10 µM) is, however, not neuroprotective. Image published in: McKay S et al. (2012) Image downloaded from an Open Access article in PubMed Central. © 2011 The Authors. British Journal of Pharmacology © 2011 The British Pharmacological Society Larger Image Printer Friendly View |