XB-IMG-125398
Xenbase Image ID: 125398
|
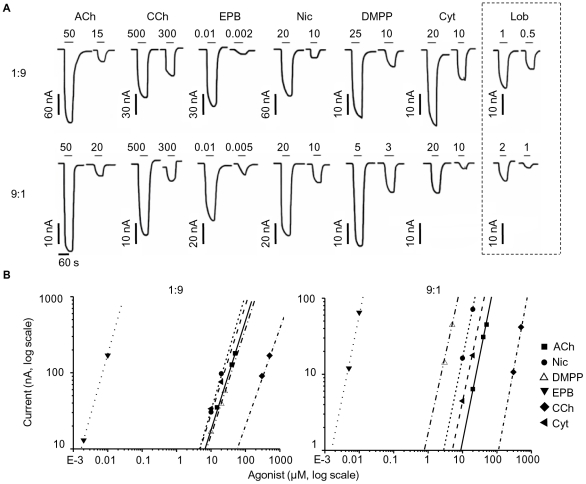
Figure 4. The two different receptor stoichiometries expressed in oocytes differ in their DMPP sensitivity.The traces in (A) are examples of inward currents elicited by low agonist concentrations (in µM) and recorded from oocytes injected with a subunit ratio of 1∶9 (top traces) and 9∶1 (bottom). The duration of each agonist application is shown above each trace (solid bar). All agonists (CCh, carbachol; EPB epibatidine; Nic, nicotine; DMPP, dimethylphenylpiperazinium; Cyt, cytisine; LOB, lobeline) were tested on the same oocyte (held at −70 mV), with the exception of lobeline (shown on the right, recorded from a different cell but with similar initial ACh current as the cell on the left, for both subunit ratios). The log-log plots in (B) are partial dose-response curves for the experiments shown in A (left). Note the increase in the potency of DMPP (10-fold leftward shift of the dose-response curve) in the 9∶1 ratio. Image published in: Krashia P et al. (2010) Krashia et al. Creative Commons Attribution license Larger Image Printer Friendly View |