XB-IMG-126517
Xenbase Image ID: 126517
|
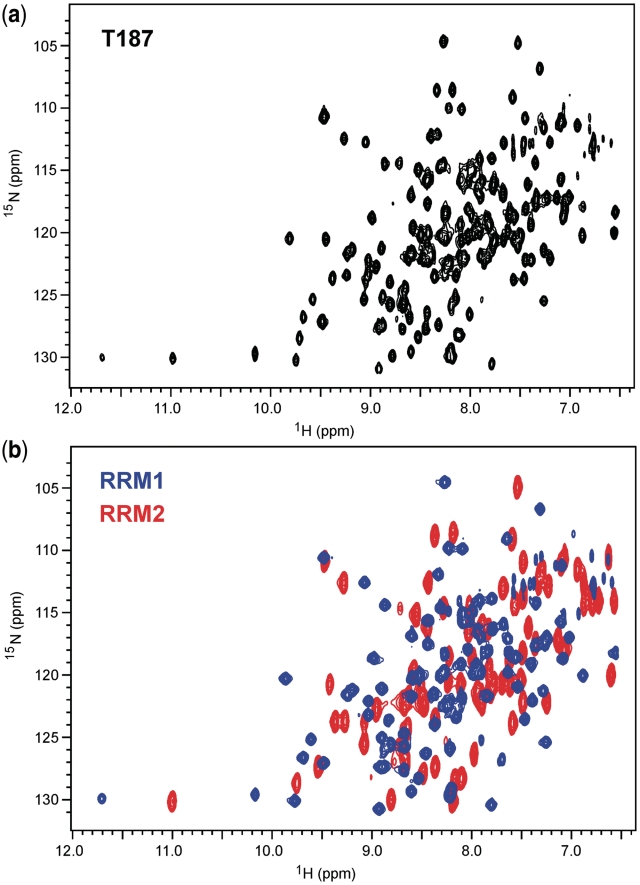
Figure 4. 2D 1H/15N-TROSY NMR spectra of T187 (a) and overlayed spectra of RRM1 (red) and RRM2 (blue) in (b) showing that the longer construct is well represented by the sum of the spectra of the individual domains, except for a few perturbations at the domain boundaries. Spectra were collected at 298 K in 25 mM phosphate buffer, 50 mM NaCl, 10% D2O (v/v), pH 7.0 with protein sample concentrations in the range 400–500 µM. Image published in: Edwards J et al. (2011) © The Author(s) 2011. Creative Commons Attribution-NonCommercial license Larger Image Printer Friendly View |