XB-IMG-126838
Xenbase Image ID: 126838
|
|
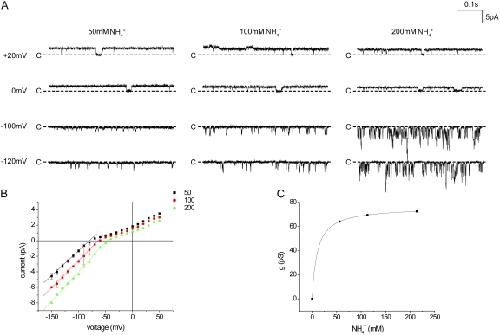
Figure 4. Conduction through Kir1.1 channels in inside-out patches with 110 mM K+ in the bath solution and different [NH4+] in the pipette. (A) Currents at different voltages and [NH4+]. (B) i-V relationships for different [NH4+]. Lines through the data points have no theoretical meaning. (C) Inward single-channel conductance measured as the slope of the i-V plots between −60 and −150 mV. The line represents the best fit of Eq. 1 to the data, with gmax = 76 ± 1 pS and Km = 10.4 ± 0.1 mM. Image published in: Yang L et al. (2012) © 2012 Yang et al. Creative Commons Attribution-NonCommercial-ShareAlike license Larger Image Printer Friendly View |