XB-IMG-126432
Xenbase Image ID: 126432
|
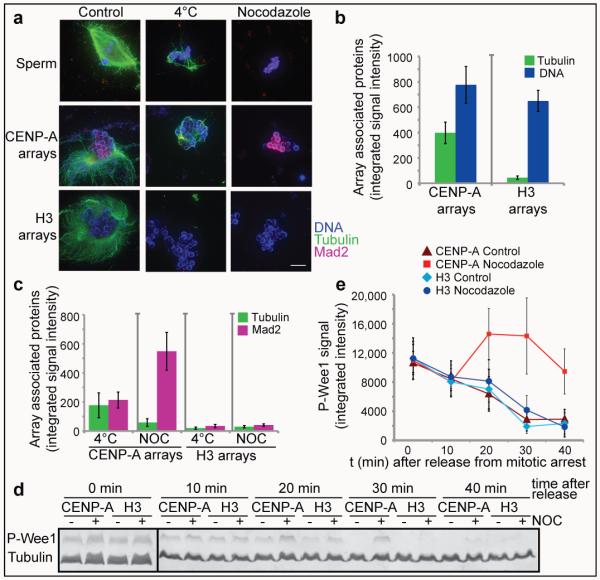
Figure 3. Kinetochores assembled on reconstituted CENP-A chromatin bind microtubules and generate a mitotic checkpoint signal(a) Representative images of microtubule polymerization induced by sperm or reconstituted CENP-A and H3 chromatin. Microtubules (green) and Mad2 (magenta) levels are shown. Scale bar, 10μm (b) Quantification of tubulin and DNA associated with CENP-A and H3 chromatin beads. Error bars represent SEM, n = 5 (c) Quantification of tubulin and Mad2 levels associated with CENP-A and H3 chromatin beads after cold shock (4°C) and nocodazole (NOC) treatment. Error bars represent SEM, n = 5 (d) Western blot showing phospho-Wee1 (P-Wee1) levels as an indicator of the cell cycle stage and tubulin levels as a loading control. Samples from different time points after release from mitotic arrest (t 0′, t 10′, t 20′, t 30′, t 40′) are shown for CENP-A and H3 chromatin arrays, each incubated with nocodazole (+) or with DMSO (−) as a control. (e) Quantification of four independent experiments showing the phospho-Wee1 signal intensity (P-Wee1 signal) over time (min). Error bars represent SEM, n = 4. Image published in: Guse A et al. (2011) Image downloaded from an Open Access article in PubMed Central. Image reproduced on Xenbase with permission of the publisher and the copyright holder. Larger Image Printer Friendly View |