XB-IMG-122481
Xenbase Image ID: 122481
|
|
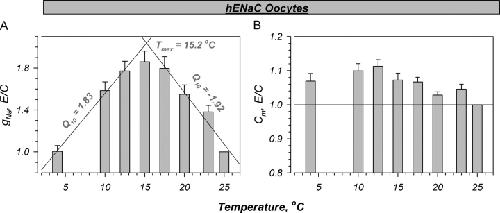
Figure 2. . Summary of the temperature-induced changes in hENaC expressing oocytes. The amiloride-sensitive conductance exhibited a biphasic relationship in response to decreasing temperature. These effects were fit with two linear relationships with slopes of −0.099 and 0.091, leading to a Q10 of −1.92 and 1.83 at high and low temperatures, respectively. These relationships intersected at a temperature of 15.2°C, defined as the maximal temperature or Tmax. A small stimulation of Cm is observed. This stimulation was not different than that observed in control oocytes (see Fig. 3), indicating no specific effects on ENaC-expressing oocytes. Data normalized to the values at 25°C that averaged 11.7 ± 1.6 mS and 0.233 ± 0.013 mF for g Na (amiloride-sensitive component) and Cm, respectively. n = 9. Image published in: Awayda MS et al. (2004) Copyright © 2004, The Rockefeller University Press. Creative Commons Attribution-NonCommercial-ShareAlike license Larger Image Printer Friendly View |