XB-IMG-125237
Xenbase Image ID: 125237
|
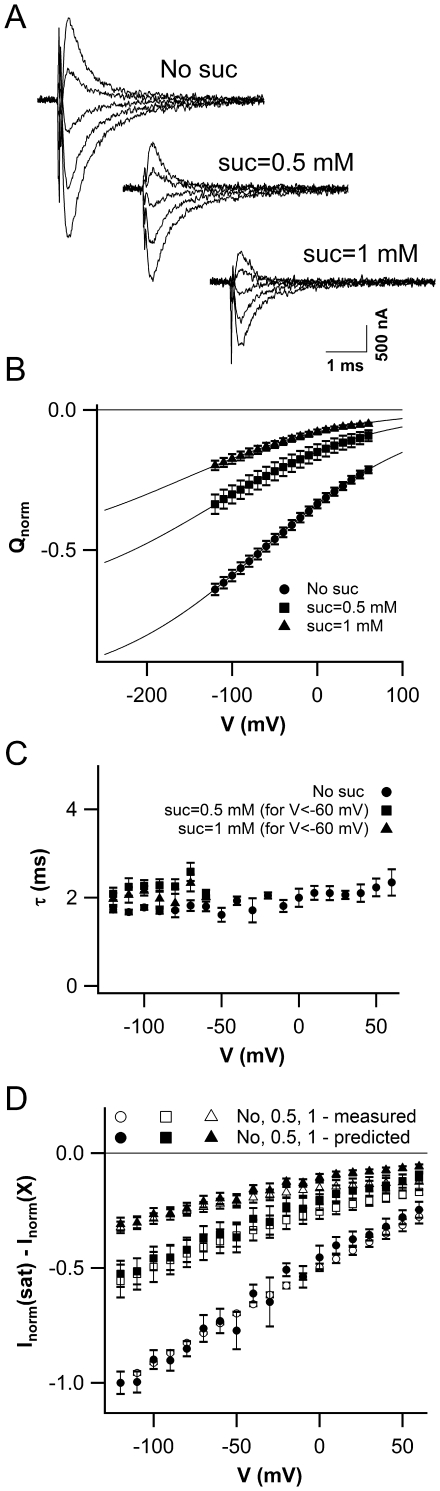
Figure 5. Sucrose dependence of ZmSUT1 presteady-state currents.A) Presteady-state currents of a single oocyte at varying external sucrose concentrations. For the sake of clarity only currents recorded from +40 to –120 mV, in 40 mV step, are shown; the holding voltage was –20 mV. B) Charge associated to presteady-state currents versus voltage at different sucrose concentrations. The continuous lines are fit of Q using a Boltzmann function (see Materials and Methods). Data for each oocyte were normalized to the maximum charge obtained in the absence of external sucrose, Qmax(No suc). The fits gave the following parameters (mean±SEM, n = 4): no external sucrose: V1/2 = −65±8 mV, s = 96±5 mV; 0.5 mM sucrose: V1/2 = −123±17 mV, Qmax(suc = 0.5 mM)/Qmax(No suc) = 0.69±0.02; 1 mM sucrose V1/2 = −159±20 mV, Qmax(suc = 1 mM)/Qmax(No suc) = 0.50±0.02. At 0.5 and 1 mM sucrose the slope s of the fit was fixed at the value obtained at 0 external sucrose. C) Isat – IX against the applied membrane potential. Isat is the current at saturating external sucrose concentration; Ix are the currents in the presence of 0, 0.5 mM and 1 mM external sucrose. Empty and filled symbols refer to the measured and predicted currents respectively. The following relationship was used in order to evaluate the predicted currents: Isat – IX = QX/τ where X represents the external sucrose concentration and τ is the slow time constant at zero external sucrose. Image published in: Carpaneto A et al. (2010) Carpaneto et al. Creative Commons Attribution license Larger Image Printer Friendly View |