XB-IMG-122813
Xenbase Image ID: 122813

|
|
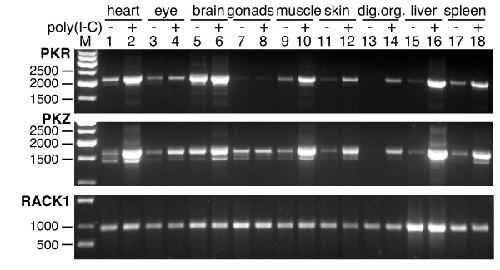
Figure 3. Comparison of expression patterns of zebrafish PKR and PKZ after induction with poly(I:C). PCRs were performed with cDNA prepared from the indicated tissues with primers covering the complete ORFs of zebrafish PKR (upper panel), PKZ (middle panel) or RACK1, the latter of which is constitutively expressed and served as control (lower panel). Zebrafish were either treated with poly(I:C) (indicated by plus) or with PBS (minus). Image published in: Rothenburg S et al. (2008) Copyright © 2008 Rothenburg et al; licensee BioMed Central Ltd. Creative Commons Attribution license Larger Image Printer Friendly View |
