XB-IMG-121137
Xenbase Image ID: 121137
|
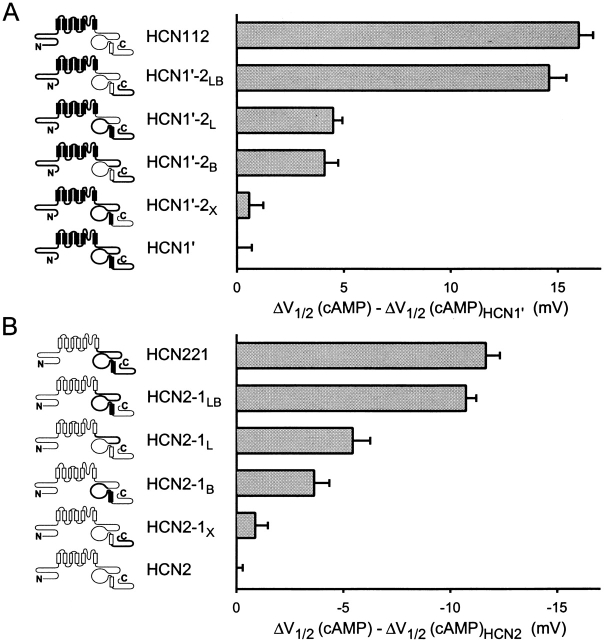
Figure 7. Contribution of COOH-terminal subdomains to differences in cAMP modulation between HCN1 and HCN2. (A) Change in response to cAMP upon replacement of COOH-terminal regions of HCN1′ with corresponding region of HCN2 (terminology as in Fig. 5). Maximal shift in V1/2 in response to 10 μM cAMP for a given channel is plotted relative to the maximal shift for HCN1′ (i.e., shift in V1/2 in response to cAMP for a given chimera minus the shift for HCN1′). Positive values indicate that a given construct shows a larger positive shift in response to cAMP compared with HCN1′. (B) Change in response to cAMP upon replacement of COOH-terminal regions of HCN2 with corresponding region of HCN1. Maximal shift in V1/2 in response to 10 μM cAMP for a given channel is plotted relative to the maximal shift for HCN2 (i.e., shift in V1/2 for a chimeric channel minus the shift for HCN2). Negative values indicate that a given construct shows a smaller positive shift in response to cAMP compared with HCN2. Mean values for the voltage shifts and the number of patches for HCN1′ and the COOH-terminal chimeras are in Table . Data for HCN2, HCN221, and HCN112 are in Table . Image published in: Wang J et al. (2001) © 2001 The Rockefeller University Press. Creative Commons Attribution-NonCommercial-ShareAlike license Larger Image Printer Friendly View |