XB-IMG-122254
Xenbase Image ID: 122254
|
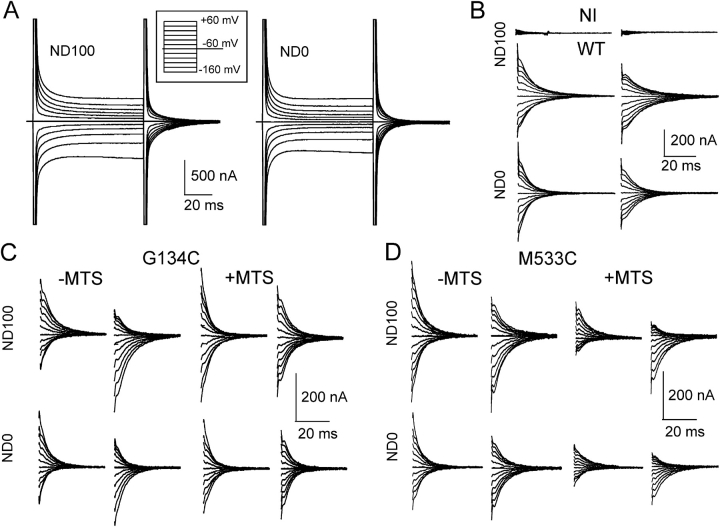
Figure 4. . Effect of MTS exposure on presteady-state relaxations of mutants. (A) Representative presteady-state relaxations recorded from an oocyte expressing the WT NaPi-IIa protein superfused in 100 mM Na+ (ND100) and 0 mM Na+ (ND0) for the voltage step protocol shown in the inset. (B) Main component of presteady-state relaxation for a noninjected oocyte (NI) and the same WT-expressing cell in A, resolved by applying a two-exponential fitting procedure (see materials and methods). The ON (step from −60 mV to test potential) and OFF (step from test potential to −60 mV) relaxations are shown for superfusion in ND100 (top and middle traces) and ND0 (bottom traces). (C) Main ON and OFF relaxations for a representative G134C-expressing oocyte before (−MTS) and after (+MTS) exposure to 1 mM MTSEA (1 mM) for 3 min, superfused in ND100 and ND0. (D) Main ON and OFF relaxations for a representative M533C-expressing oocyte before (−MTS) and after (+MTS) exposure to 1 mM MTSEA (1 mM) for 3 min, superfused in ND100 and ND0. Image published in: Ehnes C et al. (2004) Copyright © 2004, The Rockefeller University Press. Creative Commons Attribution-NonCommercial-ShareAlike license Larger Image Printer Friendly View |