XB-IMG-122172
Xenbase Image ID: 122172

|
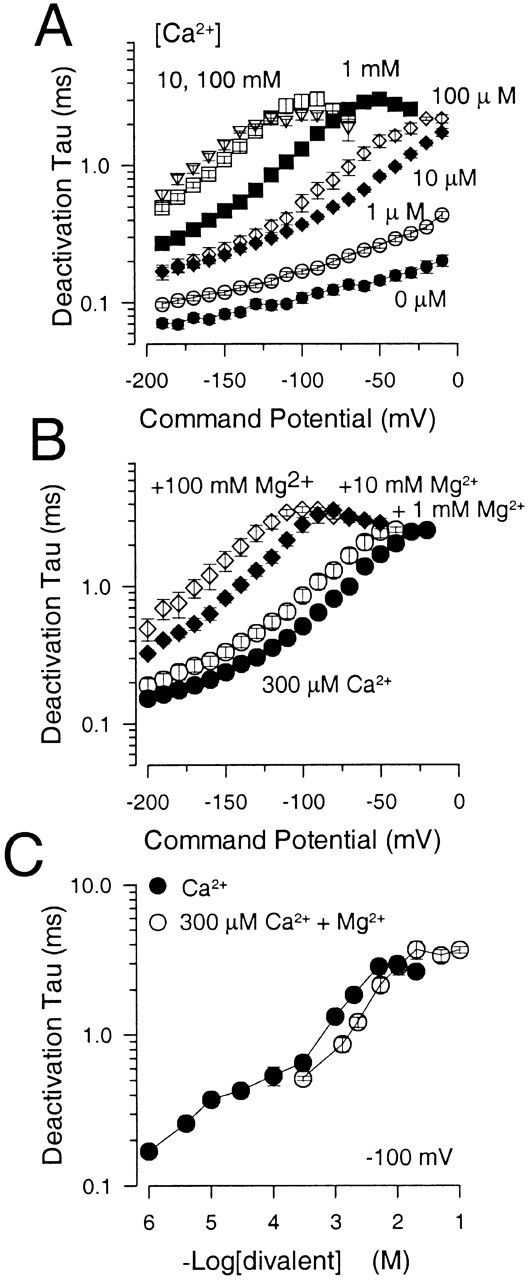
Figure 10. Millimolar concentrations of Mg2+ and Ca2+ have similar effects on current deactivation. In A, the deactivation time constants are plotted as a function of command potential for [Ca2+] spanning over six orders of magnitude, 1 μM–100 mM. Points and error bars are means and SEM of 5–15 patches. In B, the deactivation time constants are plotted as a function of command potential for tail currents obtained with 300 μM Ca2+ and 300 μM Ca2+ plus 1, 10, and 100 mM added Mg2+. Points show means and SEM for 4–8 patches. In C, the deactivation time constant measured at −100 mV is plotted as a function of total [divalent] for solutions with only Ca2+ (•) and for solutions with 300 μM Ca2+ with added Mg2+ (○). The slowing of deactivation with either elevated Ca2+ or Mg2+ exhibits saturation, although at somewhat different concentrations. Image published in: Zhang X et al. (2001) © 2001 The Rockefeller University Press. Creative Commons Attribution-NonCommercial-ShareAlike license Larger Image Printer Friendly View |
