XB-IMG-127695
Xenbase Image ID: 127695
|
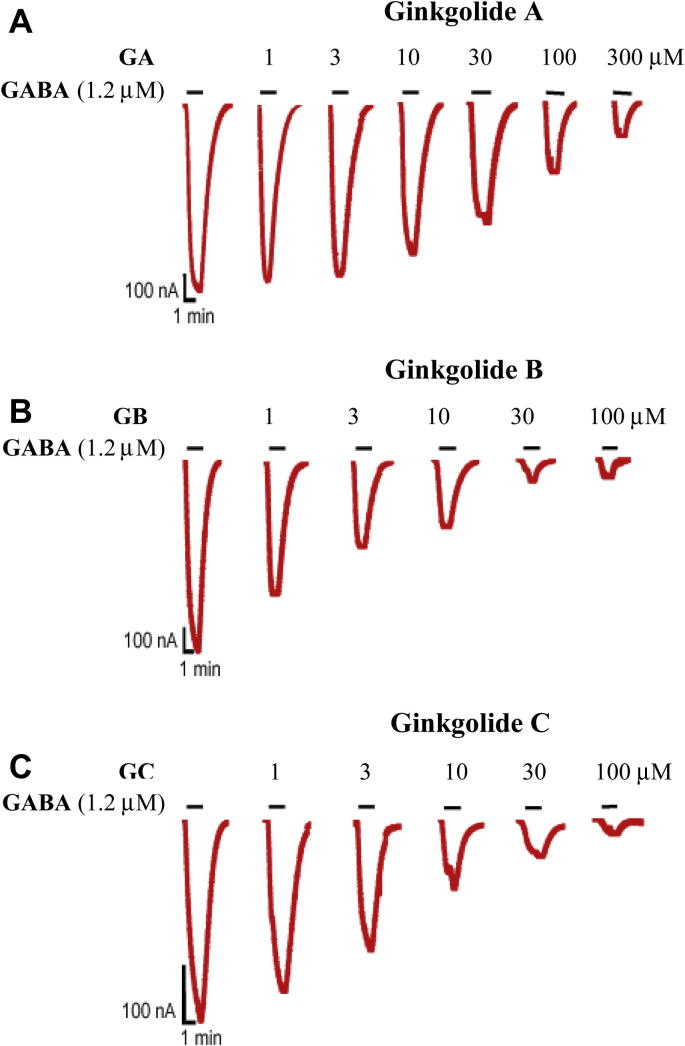
Fig. 2. Current traces produced by 1.2 μM GABA (EC50, solid bar) in the presence of (A) ginkgolide A, (B) ginkgolide B and (C) ginkgolide C at various concentrations from human ρ1 GABAC receptors expressed in Xenopus oocytes. The bars indicate duration of drug application. The ginkgolides did not have any effect on their own when tested at 100 μM. Image published in: Huang SH et al. (2012) © 2012 Elsevier Ltd. Creative Commons Attribution license Larger Image Printer Friendly View |