XB-IMG-131121
Xenbase Image ID: 131121
|
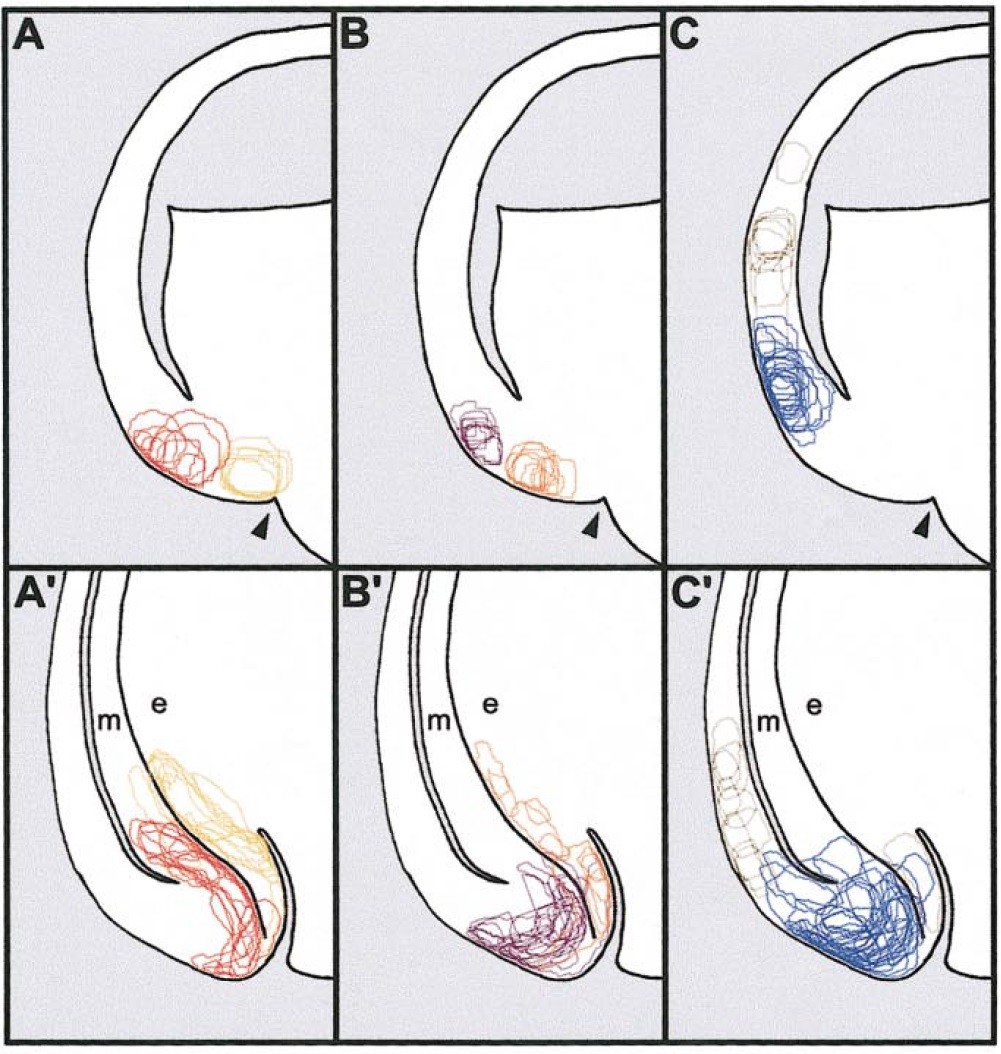
FIG. 4. Summary of ventral cell movements during involution. Initial positions of labeled cells at stage 10.5 (A–C), and final positions at
stage 12.5 (A9–C9) are indicated. Each outline represents a single patch of cells, from an individual experiment. Yellow, lower lip; red, upper
lip (A, A9). Orange, between lower and upper lip; violet, between upper lip and BCR (B, B9). Blue, BCR mesoderm; gray, ventral ectoderm
(C, C9). Arrowheads indicate the blastopore. e, endoderm; m, mesoderm. Image published in: Ibrahim H and Winklbauer R (2001) Copyright © 2001. Image reproduced with permission of the Publisher, Elsevier B. V. Larger Image Printer Friendly View |