XB-IMG-175690
Xenbase Image ID: 175690
|
Figure 2. Overall structure of XtOTOP3.(a) Top view of a 3D reconstruction of XtOTOP3 with each subunit individually colored and lipid density shown in purple. (b) Top view of a cylinder representation of the XtOTOP3 structure, with the secondary structural elements labeled in one subunit. (c) Side view of a cylinder representation of the XtOTOP3 structure. (d) Cartoon representation of a single subunit of the XtOTOP3 structure with secondary structural elements labeled. The two α-barrels from the N- and C-halves are colored purple and blue, respectively. (e) Superimposition of the two α-barrels within each subunit, with the TM numbers labeled and the two sets of constriction triads shown as yellow sticks. Loops are removed for the superimposition. (f) Zoomed-in view of the inter-subunit dimerization contacts at the two regions marked by the dotted boxes in c.
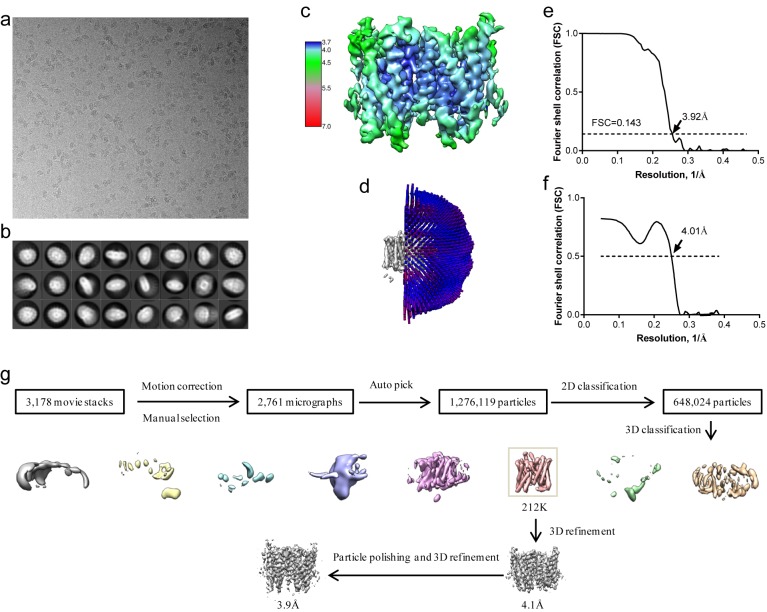
10.7554/eLife.46710.010Figure 2—source data 1. Cryo-EM data collection, refinement and validation statistics.Figure 2—figure supplement 1. Structure determination of XtOTOP3.(a) Representative micrograph of XtOTOP3 in DDM. (b) Two-dimensional class averages. (c) Final density maps colored by local resolution. (d) Euler angle distribution of particles used in the final three-dimensional reconstruction, with the heights of the cylinders corresponding to the number of particles. (e) Gold-standard FSC curves of the final 3D reconstructions. (f) FSC curves for cross-validation between the maps and the model. (g) Flowchart of image processing. Image published in: Chen Q et al. (2019) © 2019, Chen et al. Creative Commons Attribution license Larger Image Printer Friendly View |