XB-IMG-123546
Xenbase Image ID: 123546
|
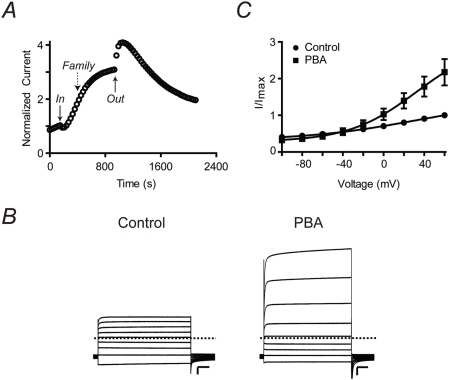
Figure 2. PBA activates Q1/E3 complexes.(A) Time course of Q1/E3 current measured in ND96 at +40 mV at the end of a 2 s pulse. The current was normalized before PBA application. PBA initially inhibits then slowly potentiates channel current. (B) Families of currents recorded in high external potassium (50 mM) before and during treatment with PBA. Currents were elicited by 2 s test potentials from −100 to +60 mV in 20 mV increments. The holding and tail potentials were −80 mV. Dashed line indicates zero current. Scale bars represent 1 µA and 0.5 s. (C) Voltage-activation curves for Q1/E3 calculated from tail current analysis. Solid curves represent Boltzmann fits to the data. Data are presented as the mean±SEM (n = 10). Image published in: Mruk K and Kobertz WR (2009) Mruk et al. Creative Commons Attribution license Larger Image Printer Friendly View |