XB-IMG-125528
Xenbase Image ID: 125528
|
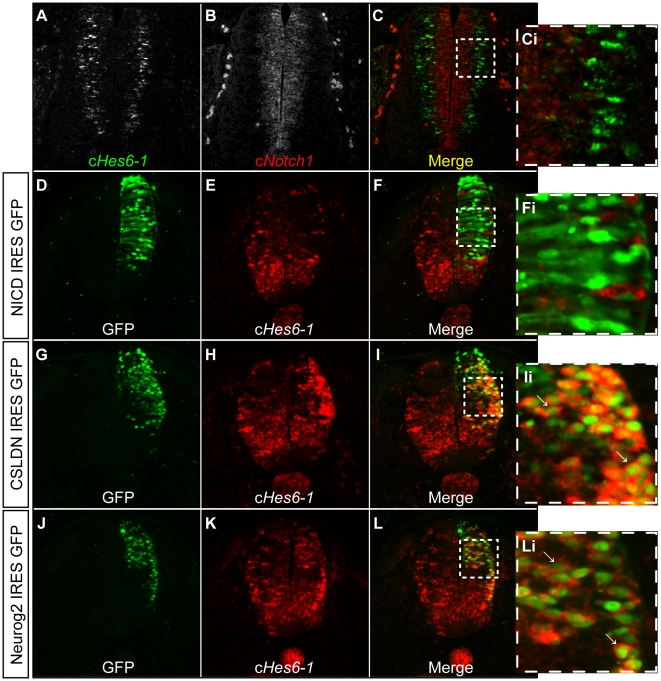
Figure 5. Regulation of cHes6-1 expression.(A-Ci) Double in situ hybridization for cHes6-1 (green) and cNotch1 (red), showing no co-expression of the two genes in spinal cord of E4 embryos. (D-Li) cHes6-1 expression in the neural tube decreases after ectopic expression of NICD (D-Fi), and increases after ectopic expression of CSLDN (G-Ii) and NEUROG2 (J-Li). (Ci), (Fi), (Ii), (Li) are magnifications of the selected areas in (C), (F), (I), (L), respectively. Arrows pinpoint electroporated cells (GFP+) with increased expression. Image published in: Vilas-Boas F and Henrique D (2010) Vilas-Boas, Henrique. Creative Commons Attribution license Larger Image Printer Friendly View |