XB-IMG-178563
Xenbase Image ID: 178563
|
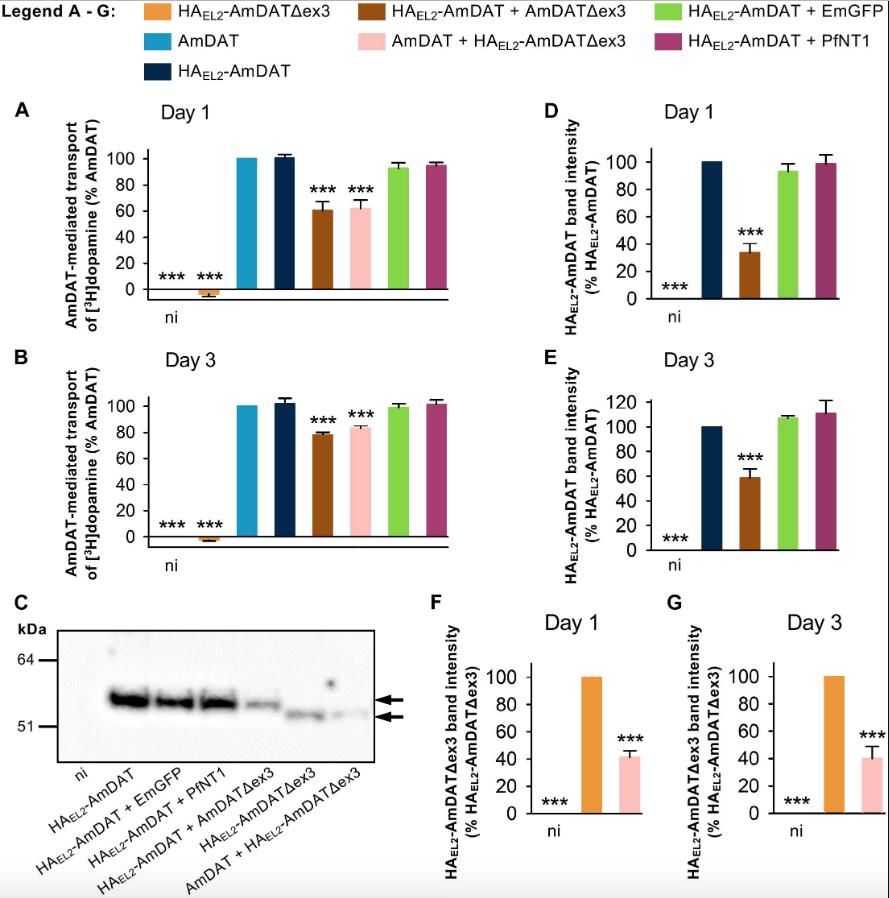
Figure 5. AmDATÎex3 downregulates AmDAT protein levels in Xenopus oocytes. The AmDAT-mediated transport of [3H]dopamine in oocytes expressing the HA-tagged forms of AmDAT or AmDATÎex3 was measured on (A) day 1 and (B) day 3 post-cRNA-injection. Non-injected oocytes (ni) were included as a negative control, EmGFP and PfNT1 were included as co-injection controls, and oocytes expressing AmDAT served as the positive control. Dopamine uptake was expressed as a percentage of that measured in the AmDAT-expressing oocytes. In both panels, the data are the mean + SEM of 3â6 independent experiments (performed using oocytes from different frogs), within which measurements were made from 10 oocytes per treatment. The capacity of HAEL2-AmDAT for dopamine transport, and the ability of HAEL2-AmDATÎex3 to downregulate AmDAT, did not differ significantly from that of its non-tagged counterpart (p > 0.05), consistent with the HA-tag exerting little or no effect upon the functions of these proteins. (C) Detection of the HAEL2-AmDAT (â¼55 kDa band indicated by black arrow) and HAEL2-AmDATÎex3 (â¼50 kDa band indicated by black arrow) proteins in oocyte membrane preparations. These western blot analyses were performed pairwise with the transport assays presented in panel (A). The samples were separated on a SDS-polyacrylamide gel and probed with a mouse anti-HA antibody. The image is representative of >3 independent experiments (performed using oocytes from different frogs) and is shown in full in Supplementary Figure S8. Semi-quantification of the (D,E) HAEL2-AmDAT and (F,G) HAEL2-AmDATÎex3 proteins in the oocyte membrane preparations was performed on day 1 panels (D,F) and day 3 panels (E,G) post-cRNA-injection. Protein band intensities were expressed as a percentage of that measured for the relevant positive control (i.e., oocytes expressing either HAEL2-AmDAT or HAEL2-AmDATÎex3). The data in panels (DâG) are shown as the mean + SEM from 3â8 independent experiments. âââ denotes a significant difference (p < 0.001) from the relevant positive control (one-way ANOVAs). Image published in: Zhang V et al. (2019) Copyright © 2019 Zhang, Kucharski, Landers, Richards, Bröer, Martin and Maleszka. Creative Commons Attribution license Larger Image Printer Friendly View |