XB-IMG-127311
Xenbase Image ID: 127311
|
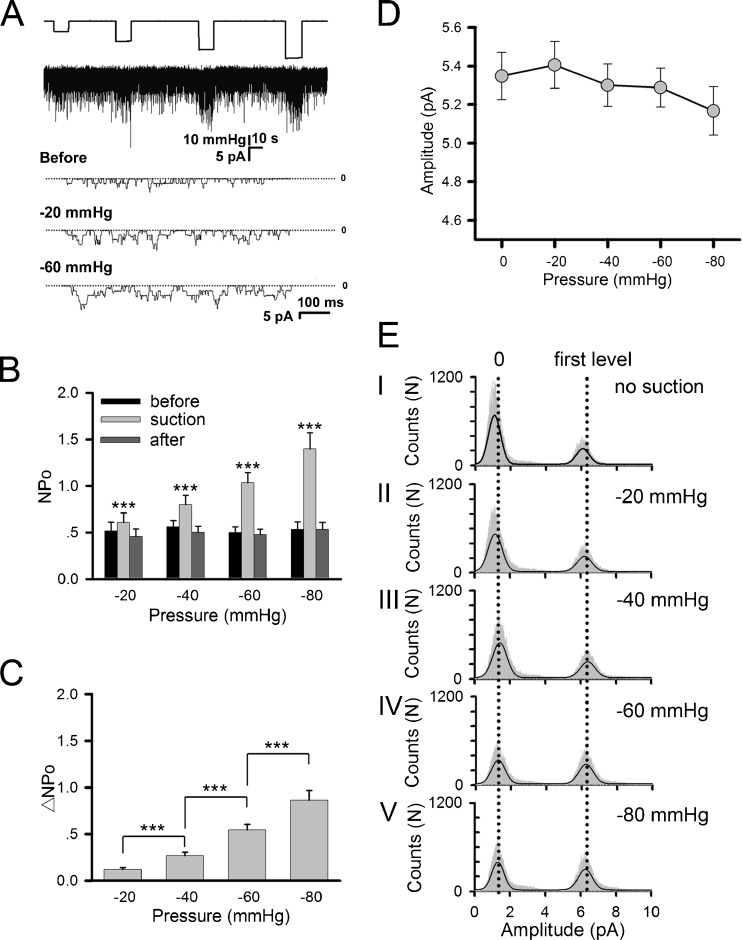
Fig. 2. Mechanosensitivity of AChRs exogenously expressed in HEK293T cells. Cells were transfected with AChR subunits α, β, δ, and γ. a Sample traces of ACh-induced currents under different negative pressures. Included in the pipette was 0.5 μM ACh. b Channel activity NPo and c its difference ΔNPo under different negative pressure levels; the former shows values before (black), during (gray), and after (dark gray) negative pressure application; n = 26, 24, 22, 10 patches for −20, −40, −60, −80 mmHg, respectively. Symbols denoting statistical significance are the same as in Fig. 1. d Mean amplitudes of single channel currents at different negative pressures. These values were calculated from all-points amplitude histograms as shown in (e), taking the difference between the first and second peak as the mean single-channel AChR current amplitude Image published in: Pan NC et al. (2012) © The Author(s) 2012. Creative Commons Attribution license Larger Image Printer Friendly View |