XB-IMG-127509
Xenbase Image ID: 127509
|
|
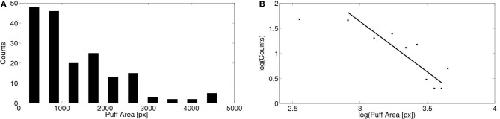
Figure 6. Distribution of puff areas obtained experimentally. (A) Similar to Figure 5 but for the area covered by the puffs. Areas were determined as explained in the “Materials and Methods” section pooling data from 179 puffs observed in 12 cells. (B) Same as (A) but on a logarithmic scale. By fitting a power law relationship to some of the data points we obtain exponents between 1.8 and 2.0 with ℛ2 between 0.77 and 0.81 (if we include data between 800 and 4500 px or between 800 and 4000 px, respectively). Image published in: Lopez L et al. (2012) Copyright © 2012 Lopez, Piegari, Sigaut and Ponce Dawson. Creative Commons Attribution license Larger Image Printer Friendly View |