XB-IMG-122578
Xenbase Image ID: 122578
|
|
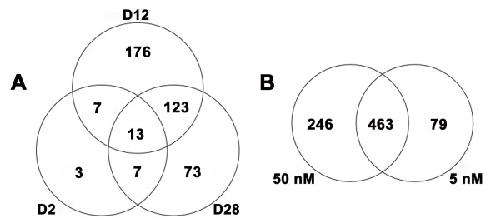
Figure 1. Results of the statistical analyses conducted on the microarray data. (A) Venn diagram showing the DEGs identified at specific time points by contrasting the two T4 concentrations and imposing fold change criteria. D2 = Day 2, D12 = Day 12, and D28 = Day 28. (B) Venn diagram depicting the relationship between DEGs that were identified via the 5 and 50 nM regression analyses and imposing fold change criteria. For panel B, fold change values are relative to Day 0. Image published in: Page RB et al. (2008) Copyright © 2008 Page et al; licensee BioMed Central Ltd. Creative Commons Attribution license Larger Image Printer Friendly View |