XB-IMG-118391
Xenbase Image ID: 118391
|
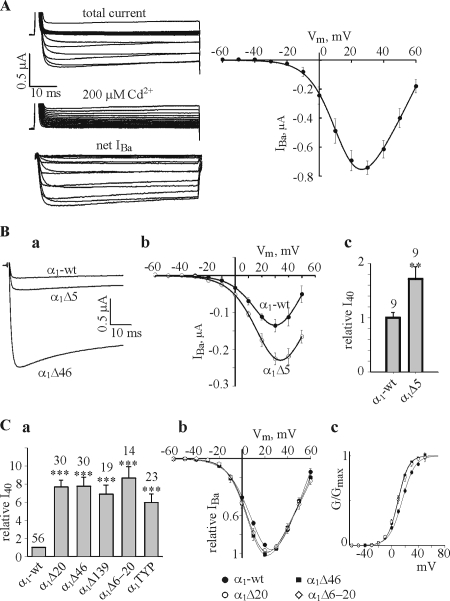
Figure 2. Effects of NH2-terminal deletions and T10A/Y13F/P15A mutation on IBa in the absence of Cavβ (the α1Cα2δ subunit composition). (A) The standard procedure used to monitor IBa, and an averaged I-V curve. See explanations in the text. (B) Comparison of IBa in α1C-wt and α1CΔ5 (2.5 ng RNA/oocyte of each subunit). Panel a shows representative current traces recorded at +40 mV in oocytes of one batch (donor). A current trace obtained in an oocyte expressing the α1Δ46 mutant is shown for comparison. Panel b shows averaged I-V curves from α1C-wt and α1Δ5 groups (n = 9 oocytes, N = 2 batches). The normalized values of I40 are shown in panel c. (C) Panel a shows the summary of relative I40 in the various mutants. I40 in each oocyte was normalized to the average I40 of α1C-wt of the same batch, as explained in Materials and Methods. Panels b and c show normalized I-V and G-V curves, respectively, of the indicated channel constructs, averaged from oocytes of two representative batches (n = 8–14, N = 2). Amount of injected RNA was varied from 0.3 ng/oocyte in NT mutants to 5 ng/oocyte in α1-wt to reach comparable IBa amplitudes in order to minimize the fitting artifacts. Note that Boltzmann fits have been performed separately in each oocyte. For illustration purposes, in averaged I-V and G-V curves shown in C and in the following figures, the solid lines through averaged experimental points were drawn using Boltzmann equation with values of V1/2 and Ka from Table I. In this and the following figures, the numbers above bars indicate the number of cells tested, and asterisks indicate statistically significant differences, as follows: *, P < 0.05; **, P < 0.01; ***, P < 0.001. Image published in: Kanevsky N and Dascal N (2006) Copyright © 2006, The Rockefeller University Press. Creative Commons Attribution-NonCommercial-ShareAlike license Larger Image Printer Friendly View |