XB-IMG-130113
Xenbase Image ID: 130113
|
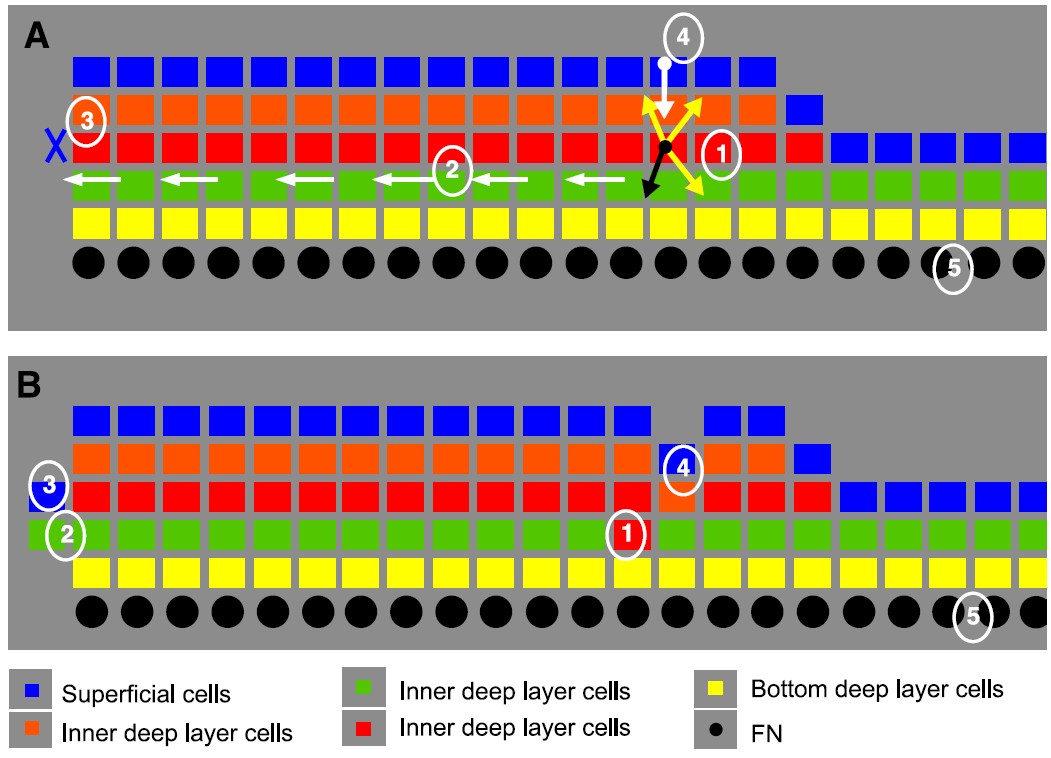
Fig. 2. Cellular behavior is governed by the set of rules incorporated in the simulation. (A) This diagram represents a sequence of cell movements and actions
that are possible given the defined set of rules: (1) an inner deep layer cell is selected at random to move. The black arrow and the three yellow arrows
emanating from the selected cell represent the possible directions the cell can move in. The black arrow represents the randomly selected direction. The red cell
intercalates between the two green cells on either side of the black arrow, (2) all of the green cells to the left of the intercalated red cell are displaced one cell
diameter to the left, (3) the superficial cell layer extends (spreads) to cover the protruding green cell layer, (4) an orange deep cell drops down to fill the gap
created by the intercalated red cell. The superficial cell layer conforms to fill the gap created by the orange cell, (5) the FN intensity associated with each bottom
(yellow) deep layer cell is incremented if the residency time and cell-to-cell contact criteria are met. (B) The tissue geometry after the events described in (A)
have occurred. Image published in: Longo D et al. (2004) Copyright © 2004. Image reproduced with permission of the Publisher, Elsevier B. V. Larger Image Printer Friendly View |