XB-IMG-118856
Xenbase Image ID: 118856

|
|
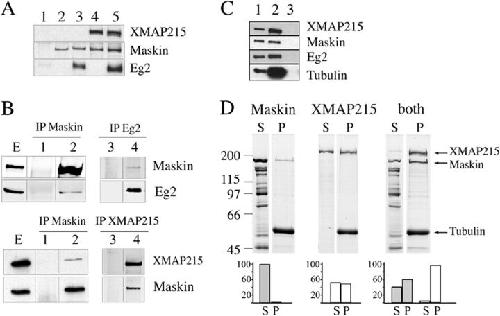
Figure 4. Maskin binds to microtubules and interacts with XMAP215 and Eg2 in vitro and in the egg extract. (A) Western blot of GST pull-downs in vitro with GST (lane 1) or GST-Maskin (lanes 2–5) in the presence of GFP-Eg2 (lane 3) or His-tagged XMAP215 (lane 4) or both (lane 5). Proteins recovered with the anti-GST antibody–coated beads were run on SDS-PAGE and blotted. The blot was probed with anti-XMAP215, anti-GST (to detect GST-Maskin), and anti-Eg2 antibodies to detect the corresponding proteins as indicated on the right. (B) Immunoprecipitations from CSF-arrested egg extract with different antibodies as indicated. (Lanes E) Total extract. (Lanes 1 and 3) Control immunoprecipitation with unspecific IgG. (Lanes 2 and 4) Immunoprecipitated proteins with specific antibodies as indicated. The blots were probed with anti-XMAP215, anti-Maskin, and anti-Eg2 antibodies to detect the presence of the corresponding proteins as indicated on the right. (C) Western blot analysis of a 0.5-μl total egg extract (lane 1), a microtubule pellet from 10 μl of egg extract incubated with taxol (lane 2), a pellet obtained from 10 μl of extract incubated with nocodazole (lane 3). The blot was probed with specific antibodies to detect the presence of the corresponding proteins as indicated on the right. Endogenous XMAP215, Maskin, and Eg2 copellet efficiently with microtubules in the extract. (D) Binding of Maskin or XMAP215 or both to microtubules in vitro. (D, top) Coomassie blue–stained gel from a representative microtubule pelleting experiment. GST-Maskin and XMAP215 at 1 μM final concentration were incubated with 3 μM taxol-stabilized microtubules either independently (left, Maskin; middle, XMAP215) or together (right, both). The supernatants (S) and pellets (P) obtained after centrifugation of the samples were run on SDS-PAGE and the gel stained with Coomassie blue. The positions of the XMAP215, Maskin, and tubulin bands are indicated on the right. Equivalent amount of the supernatants and pellets were run for direct comparison. (D, bottom) Quantification of the bands from the gel showing the proportion of proteins recovered in the supernatant and in the pellets (Maskin, gray bars; XMAP215, white bars) in each condition. The percentage of each protein in the pellet (P) and supernatant (S) was calculated over the total amount (S + P = 100%). This experiment was repeated five times and two gels were run for each experiment. Similar results were obtained in all independent experiments. Image published in: Peset I et al. (2005) Copyright © 2005, The Rockefeller University Press. Creative Commons Attribution-NonCommercial-ShareAlike license Larger Image Printer Friendly View |
