XB-IMG-125754
Xenbase Image ID: 125754
|
|
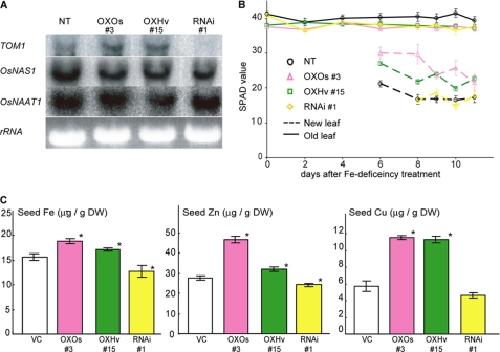
FIGURE 7. In vivo function of TOM1 in rice. A, Northern blot analysis in Fe-deficient roots of NT plants; plants overexpressing TOM1 (OXOs) or HvTOM1 (OXHv); and plants with RNAi-repressed TOM1 expression (RNAi). B, SPAD values (chlorophyll content) of the newest and oldest leaves of OXOs, OXHv, RNAi, and NT plants during progression of Fe deficiency stress (0 days) and 12 days later. Error bars represent S.E. (n = 3–6). C, Fe, Zn, and Cu contents in OXOs, OXHv, RNAi, and vector control (VC) seeds. Error bars represent S.D. *, significant difference (p < 0.01) by Student's t test. Image published in: Nozoye T et al. (2011) © 2011 by The American Society for Biochemistry and Molecular Biology, Inc. Creative Commons Attribution-NonCommercial license Larger Image Printer Friendly View |