XB-IMG-123166
Xenbase Image ID: 123166
|
|
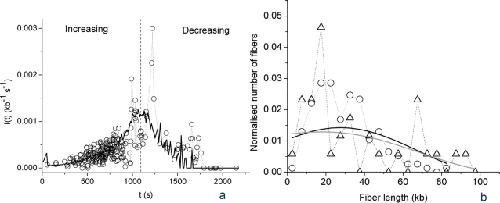
Figure 7. Analysis of a novel set of experimental data using the model shown on Figure 6.(A) Comparison of the novel data points (open circles, see text) with a rescaled fit to the previous data set (Figure 6). (B) Normalised distributions of fibre length in increasing (circles) and decreasing (triangles) parts of the data. The solid black and grey lines represent the smoothed distributions (using a 5 points Fourier filter) of the increasing and decreasing parts of the data, respectively. Image published in: Goldar A et al. (2008) Goldar et al. Creative Commons Attribution license Larger Image Printer Friendly View |