XB-IMG-156338
Xenbase Image ID: 156338

|
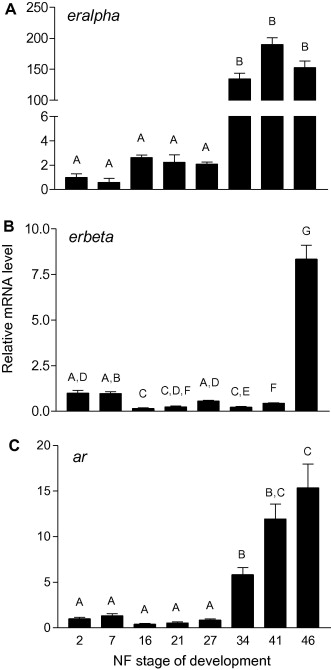
Fig. 2.
Developmental profiles of sex steroid-related genes during S. tropicalis embryogenesis and larval development. Transcript levels of eralpha (A), erbeta (B) and ar (C), were measured in whole embryos and larvae from NF 2 (two-cell stage) to NF 46 (beginning of feeding). Levels of mRNA are expressed relative to NF 2 and are normalized to RNA content. Bars represent the mean + SEM. Different letters indicate statistically significant differences between stages (n = 6–8 pools; p < 0.05). Note that the scales of the y-axis vary between genes. Image published in: Duarte-Guterman P et al. (2010) Copyright © 2010. Image reproduced with permission of the Publisher, Elsevier B. V. Larger Image Printer Friendly View |
