XB-IMG-136680
Xenbase Image ID: 136680
|
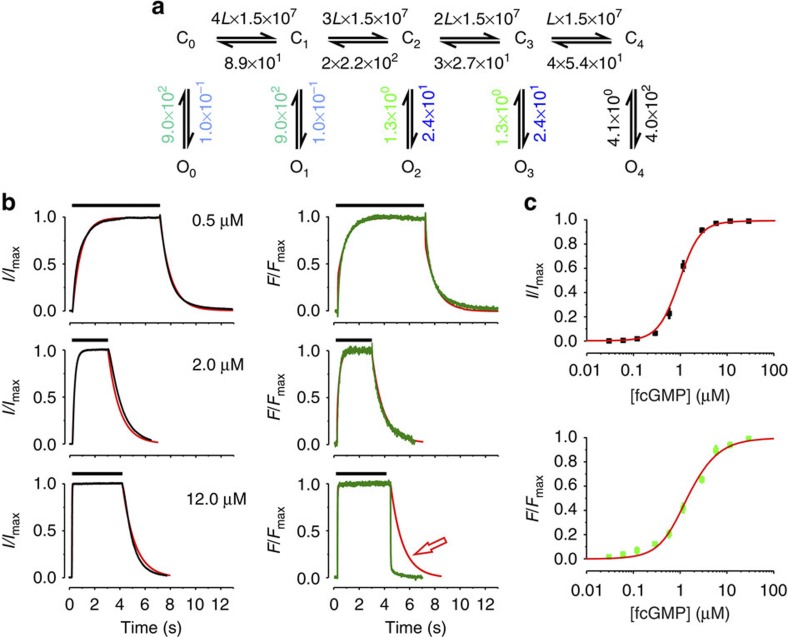
Figure 2. Fit of ligand binding and activation with the C4L model.(a) Scheme of the C4L model. Cx and Ox (n=0…4) denote closed and open states, respectively. L is a ligand. The numbers are the values of the rate constants (s−1 or s−1 M−1) determined by the fit. Rate constants set equal in the fit are indicated by using the same colours. The errors for each rate constant are given in Supplementary Table S1. (b) Time courses of binding and unbinding (green) as well as activation and deactivation (black) for three fcGMP concentrations. The time interval between the concentration jump from 0 to the respective fcGMP concentration and back to 0 is indicated for each trace by the black bar at the top. (c) Steady-state relationships for activation (black symbols) and ligand binding (green symbols). Each data point is the mean of measurements obtained from 6 to 15 patches. Error bars denote s.e.m. The red curves in b and c are the result of the best global fit of the time courses of ligand binding and activation as well as the steady-state relationships with the parameters shown in a. The reduced χr2 for the activation/binding and steady-state was 5.0. Image published in: Nache V et al. (2013) Copyright © 2013, Nature Publishing Group, a division of Macmillan Publishers Limited. Creative Commons Attribution-NonCommercial-NoDerivatives license Larger Image Printer Friendly View |